

Markets pushed higher on Thursday after a cooler-than-expected U.S. producer price report reinforced bets that the Federal Reserve will hold off on raising interest rates next month. The S&P 500 touched a fresh record, extending a global equity rally that began overnight with a surge in Asian chip stocks, even as a split field of Fed officials offered conflicting signals on the path ahead. The U.S. dollar swung in both directions across the Asian, London, and U.S. sessions before closing mixed, and arguably a shade firmer, against most major currencies.
Check out the forex news and economic updates you may have missed in the latest trading session!
News Headlines & Data:
- U.K. RICS House Price Balance for July 2026: -30.0% (-30.0% forecast; -33.0% previous)
- Japan PPI for July 2026: 7.2% y/y (7.2% y/y forecast; 7.1% y/y previous)
- New Zealand Business Inflation Expectations for Q3 2026: 2.34% (2.7% forecast; 2.53% previous)
- U.K. Balance of Trade for June 2026: -5.54B (-3.6B forecast; -1.04B previous)
- U.K. GDP Growth Rate for Q2 2026: 1.2% y/y (1.2% y/y forecast; 0.9% y/y previous); 0.4% q/q (0.3% q/q forecast; 0.6% q/q previous)
- Swiss Producer & Import Prices for July 2026: -2.1% y/y (-1.6% y/y forecast; -2.1% y/y previous)
- Euro area Industrial Production for June 2026: 0.0% (-0.1% forecast; -0.2% previous)
- U.S. Initial Jobless Claims for August 8, 2026: 209.0k (204.0k forecast; 199.0k previous)
-
U.S. PPI for July 2026: 4.7% y/y (5.0% y/y forecast; 5.5% y/y previous)
- U.S. Core PPI for July 2026: 4.2% y/y (4.3% y/y forecast; 4.7% y/y previous)
Broad Market Price Action:
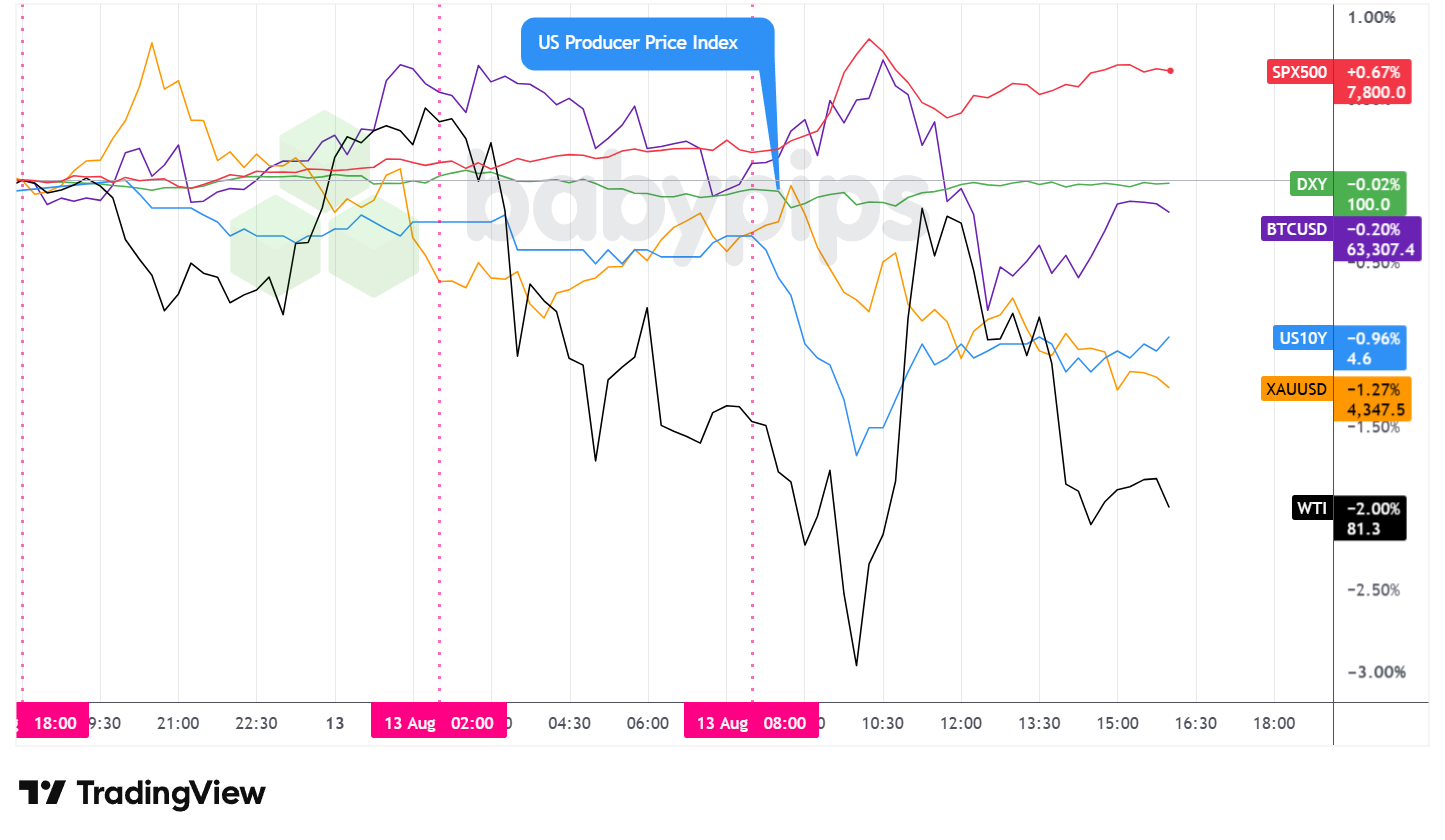
Dollar Index, Gold, Oil, S&P 500, U.S. 10-yr Yield, Bitcoin Overlay – Chart Faster With TradingView
Thursday’s session extended a global equity rally that began overnight in Asia, where a surge in U.S. semiconductor shares lifted sentiment across the region. Japan’s Topix touched a record high and the Nikkei added roughly 1.6%, while South Korea’s Kospi jumped around 4% on heavy buying in Samsung and SK Hynix.
The rally carried into Wall Street after the U.S. producer price index for July rose 4.7% year over year, below both the 5.0% forecast and June’s 5.5% pace, with the monthly reading flat. Money markets responded by trimming the odds of a September Fed rate hike to under 40%. The S&P 500 pushed to a fresh record high above 7,816 shortly after the report, then pared some of the advance to close near 7,800, up roughly 0.67% on the day, while the Nasdaq 100 outperformed with a gain of about 1.15%. Underneath the headline numbers, the advance was uneven: Sandisk shares surged around 14%, Intel, FedEx, Netflix, and Meta posted smaller gains, Cisco fell about 8% on cautious revenue guidance that came in above consensus, and Workday climbed on takeover speculation.
Fed commentary added to the day’s crosscurrents. Richmond Fed President Tom Barkin argued for holding rates steady given signs that inflation is cooling, though he acknowledged a risk that some price pressures could still become embedded. Cleveland’s Beth Hammack pushed back, questioning whether the recent slowdown will hold and repeating her call to raise rates now. Thursday’s report, paired with last week’s softer jobs data, may give Fed Chair Kevin Warsh some additional room heading into the September meeting.
Treasury yields eased through the session, with the 10-year down about 1.7 basis points to around 4.675% by the London morning before extending its decline to roughly 4.6% by the U.S. close, tracking the softer inflation data. The move sat alongside Thursday’s 30-year bond auction, which cleared at the highest yield in roughly a quarter century, underscoring that investors are still demanding extra compensation to help finance the widening federal deficit even as near-term inflation data cools.
Gold moved the other way. The metal pulled back from a stronger overnight high in Asia and was down about 0.4% near $4,388 by the London morning, then extended its slide through the U.S. session to close around $4,347, off roughly 1.3% on the day, despite falling Treasury yields, a combination that would typically offer support. Gold showed a similar disconnect earlier this month when cooler CPI and payrolls data likewise failed to lift prices, so Thursday’s slide may say more about profit-taking or positioning than about the day’s inflation news specifically.
Oil had the most volatile session of the day. WTI crude slipped in Asian trading, and the decline continued into the London morning, with crude down about 2% near $81.58. It then extended further into the U.S. session and bottoming around $80.30, even as headlines pointed to fresh attacks on Middle East oil shipping chokepoints, a combination typically bullish for crude. Energy-sector equities didn’t confirm the move either, holding up better than crude’s slide alone would suggest. Prices then rebounded sharply back toward the $83 area before fading again into the close, settling near $81.50, down roughly 2% on the day.
Bitcoin moved through its own round trip without an obvious catalyst. The cryptocurrency rallied through the Asian session to a high near $63,950, gave back the gains through London and into the PPI release, bottomed near $62,775, then clawed back most of the drop to close little changed, down roughly 0.2% near $63,307. Lacking asset-specific news, the swing may simply reflect the same shifts in risk appetite that moved stocks and yields through the session.
FX Market Behavior: U.S. Dollar vs. Majors
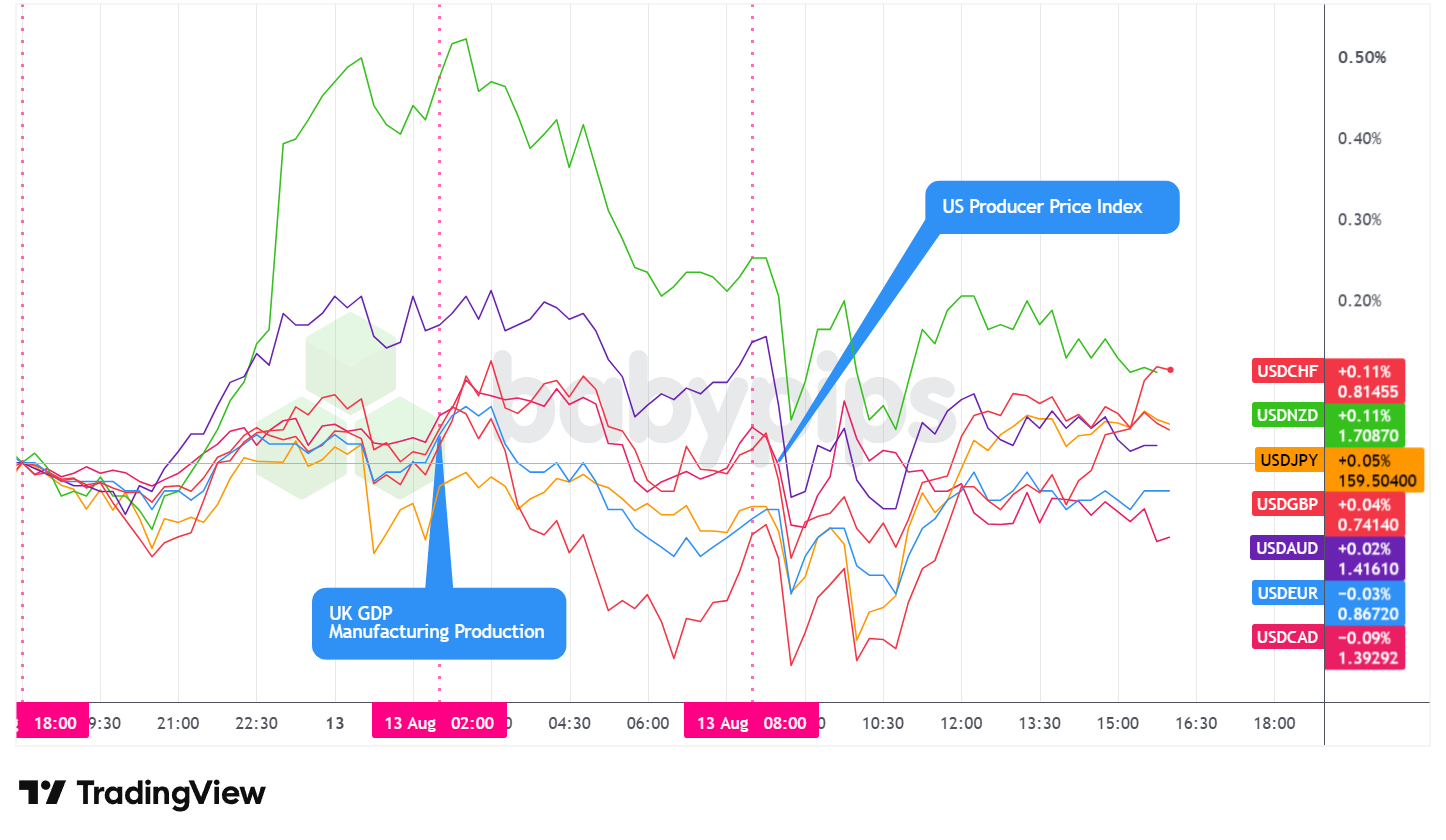
Overlay of USD vs. Major Currencies – Chart Faster With TradingView
The Dollar Index closed little changed, down roughly 0.02% near the 100.00 handle, though that steadiness masked a choppy session underneath.
During the Asian session, the dollar traded choppy and mixed, dipping, rebounding, and dipping again as the session wore on. Japan’s July producer price index held elevated at 7.2% year over year, matching forecasts but still running hot enough, on the back of a roughly 29% jump in yen import prices, to keep a September Bank of Japan rate hike in play. The dollar’s clearer gains came against the Australian and New Zealand dollars. The Aussie softened after remarks from Reserve Bank of Australia Assistant Governor Christopher Kent, which markets read as more dovish than the substance of his comments arguably supported, while the kiwi eased after New Zealand’s third-quarter inflation expectations survey showed a sharper-than-expected pullback, trimming the odds of a Reserve Bank of New Zealand hike at its September 2 meeting.
The London session brought a net pullback for the dollar before trading stabilized heading into the U.S. open. The greenback recovered from its overnight lows late in the Asian session, then drifted mostly sideways to lower through European morning trade. EUR/USD held a narrow range, up around 0.1% near 1.1535, while USD/JPY sat little changed around the 159.20 to 159.30 area for most of the session. U.K. data added to the session’s backdrop without appearing to move the dollar much: second-quarter GDP grew 1.2% year over year, matching forecasts, alongside a softer set of trade and industrial production figures.
After the U.S. session opened, dollar volatility picked up (along with notable choppiness) before finally stabilizing through the afternoon. That back-and-forth lines up with the session’s conflicting signals: the cooler PPI print initially weighed on the dollar by trimming rate-hike odds, while a mixed round of Fed commentary (Richmond’s Barkin leaning toward a hold, Cleveland’s Hammack still pushing for a hike) and a broader pickup in risk appetite appeared to pull the currency back the other way. Weekly jobless claims came in a touch above forecast at 209,000, adding a modestly softer note to the labor backdrop without shifting the broader narrative.
At Thursday’s close, the dollar finished mixed but arguably firmer overall against the majors on the day, gaining against the Swiss franc, New Zealand dollar, Japanese yen, British pound, and Australian dollar, while slipping slightly against the euro and Canadian dollar.
Upcoming Potential Catalysts on the Economic Calendar
- New Zealand Business NZ PMI for July 2026 at 10:30 pm GMT
- New Zealand Visitor Arrivals for June 2026 at 10:45 pm GMT
- RBA Gov Bullock Speech at 11:30 pm GMT
- Australia Investment Lending for Homes for June 30, 2026 at 1:30 am GMT
- Australia Home Loans for June 30, 2026 at 1:30 am GMT
- Germany Wholesale Prices for July 2026 at 6:00 am GMT
- Swiss GDP Growth Rate Flash for June 30, 2026 at 7:00 am GMT
- China Monetary Developments for July 2026
- Euro area Trade Balance for June 2026 at 9:00 am GMT
- Euro area Employment Change Prel for June 30, 2026 at 9:00 am GMT
- Euro area GDP Growth Rate 2nd Est for June 30, 2026 at 9:00 am GMT
- Canada Manufacturing & Wholesale Sales Final for June 2026 at 12:30 pm GMT
- Canada New Motor Vehicle Sales for June 2026 at 12:30 pm GMT
- Canada Capacity Utilization Rate for June 2026 at 12:30 pm GMT
- U.S. Retail Sales for July 2026 at 12:30 pm GMT
- U.S. Michigan Inflation Expectations Prel for August 2026 at 2:00 pm GMT
- University of Michigan Consumer Sentiment Index for August 2026 at 2:00 pm GMT
Friday’s calendar extends Thursday’s inflation-versus-growth debate into a new session. U.S. retail sales for July and the University of Michigan’s preliminary August sentiment and inflation expectations survey will likely be read against Thursday’s cooler PPI print for clues on whether the market’s reduced rate-hike odds are justified.
Reserve Bank of Australia Governor Bullock is due to speak hours after her deputy’s remarks weighed on the Aussie on Thursday, and a busy European slate, including Germany’s wholesale prices and the euro area’s second GDP estimate, rounds out a session that could add fresh cross currents for the dollar.
Stay frosty out there, forex friends!
Thursday’s mixed dollar performance wasn’t random. It was the result of stocks rallying, yields falling, gold unexpectedly declining, and oil whipsawing all at the same time. Most forex traders watch only currency charts and miss why these things happen. Premium members can read our lesson:
📖 What Is Intermarket Analysis?
Reading this helps you understand how stocks, bonds, commodities, and currencies move together, why gold fell despite lower yields, and how to spot the cross-asset signals that explain price action faster than any single chart can.
And if you’re not a Premium subscriber yet, this article is a perfect example of why it matters. Consider joining.
With Babypips Premium, you get full access to School of Pipsology lessons that help you understand how to read the moves across all asset classes before they show up on your currency chart.

