

Bitcoin (BTC) has staged a strong recovery after falling to a yearly low of $57,800 in July, gaining nearly 33% and recording two consecutive months of gains in July and August.
But despite that rebound, Bitcoin remains around 40% below its all-time high (ATH), leaving one key question for traders: is this the start of a new bullish phase, or simply another recovery within a broader bear-market cycle?
This report examines Bitcoin’s market structure, institutional demand, macroeconomic backdrop and on-chain indicators to assess whether the current recovery can develop into a sustained uptrend.
Duration of the bear market
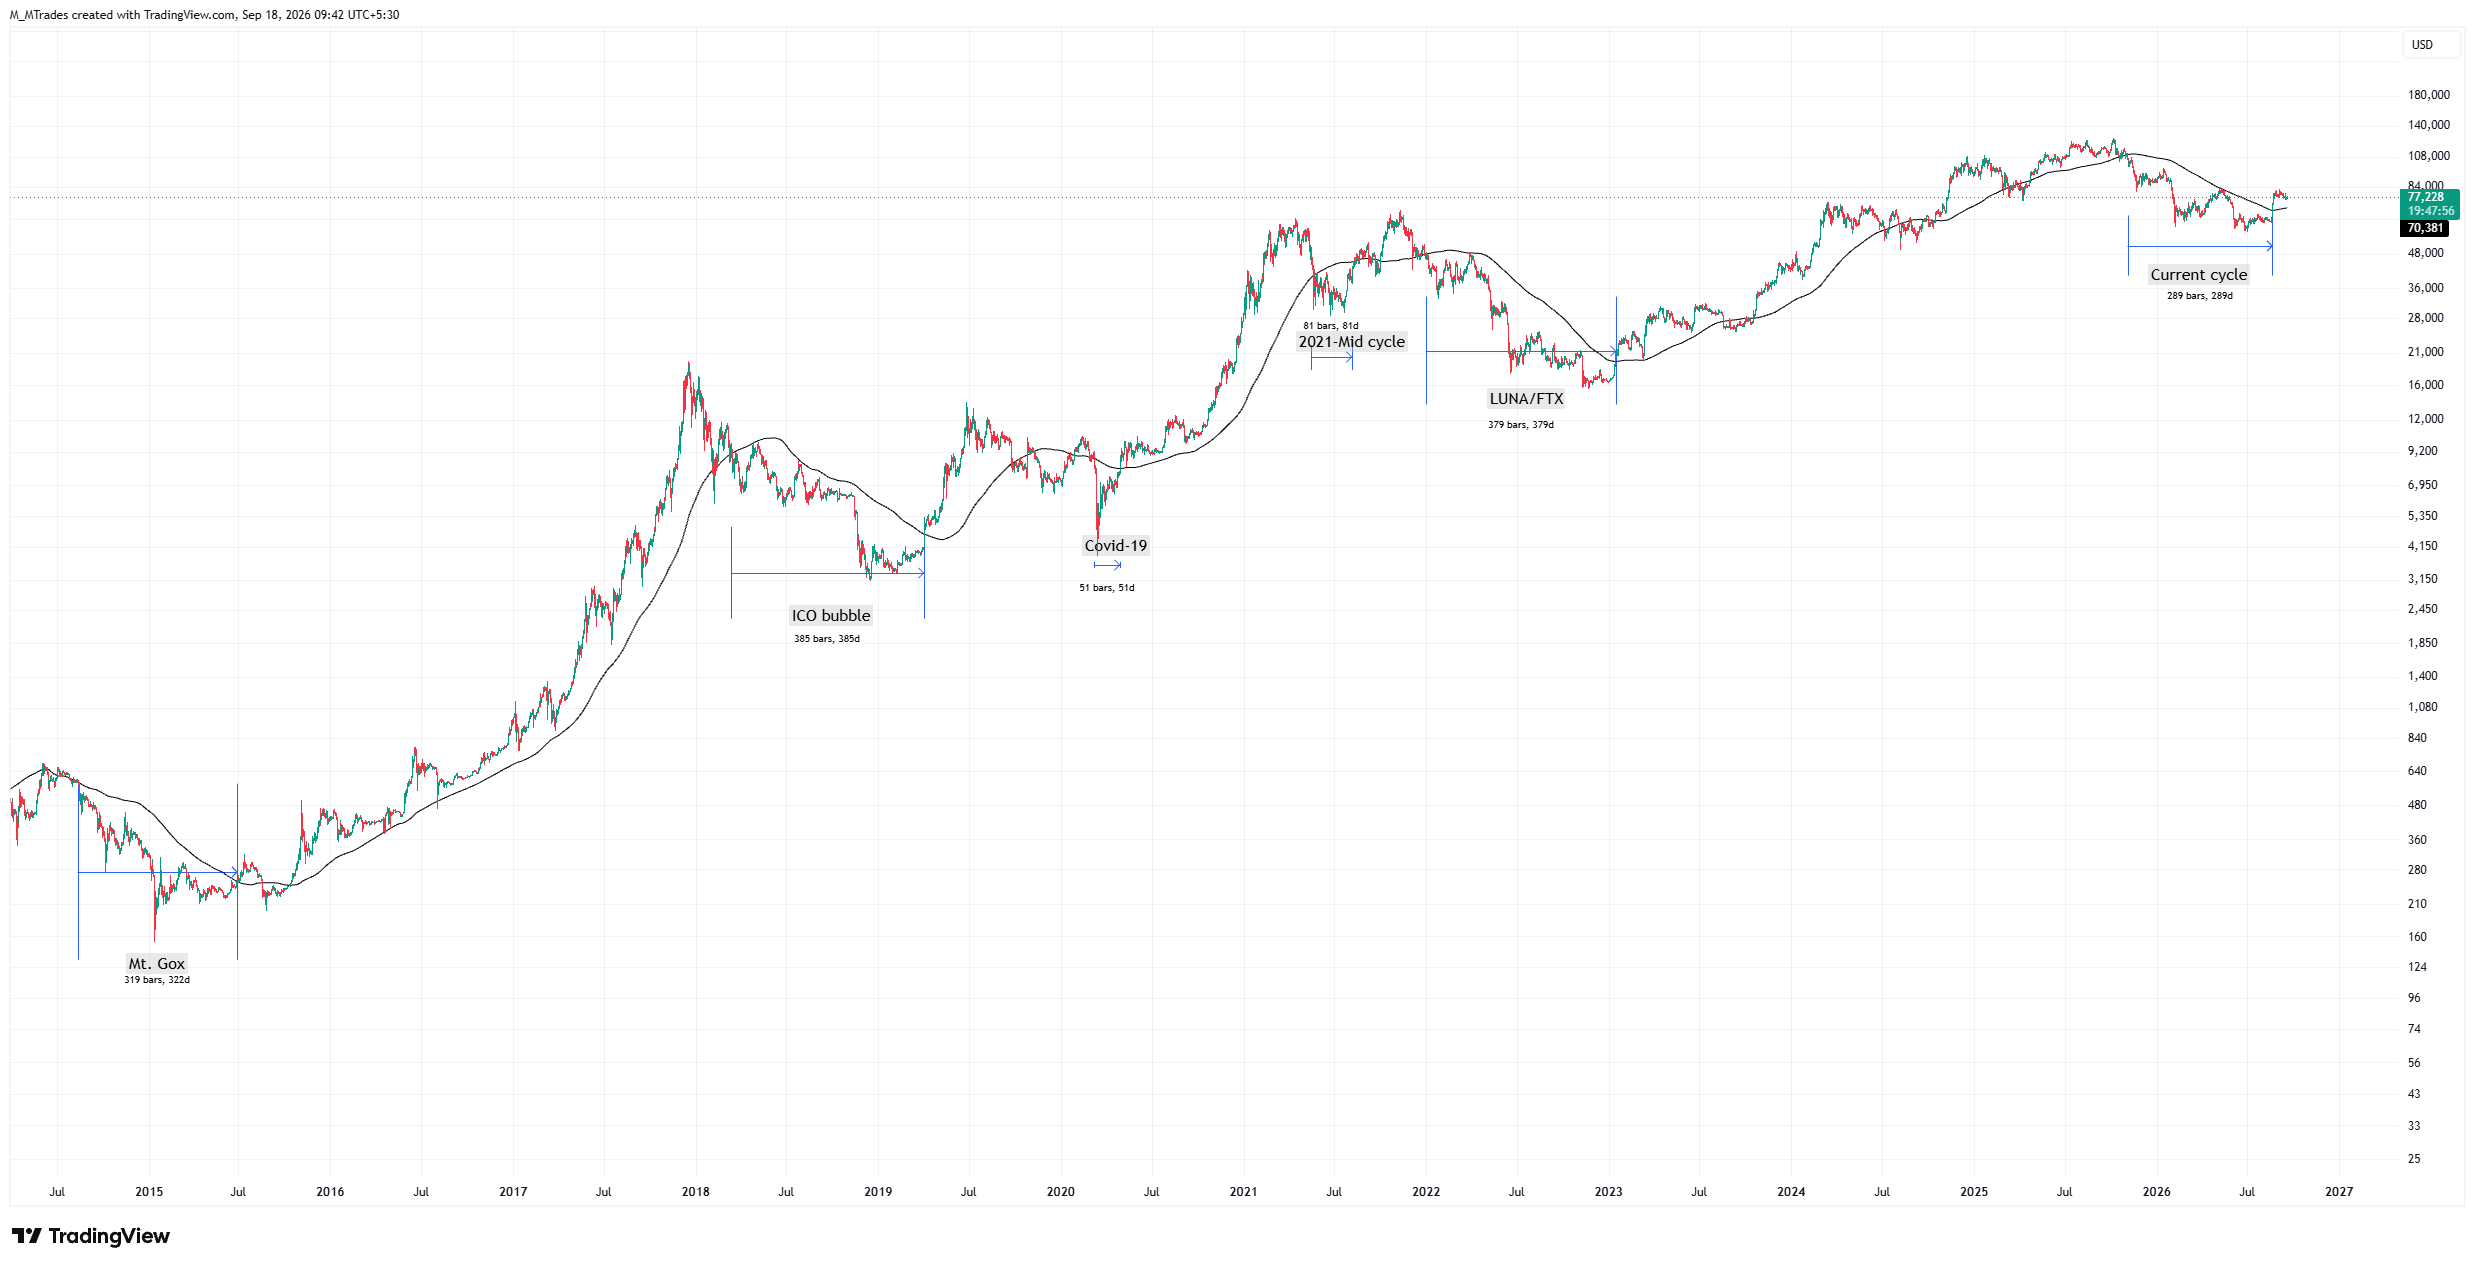
The chart below shows each bearish cycle as any period where BTC trades under its 200-day Simple Moving Average (SMA) for 30 or more consecutive days. The current cycle has lasted roughly 290 days, with BTC closing above the 200-day SMA in mid-August; this makes it the fourth-longest bear cycle of the 6 shown in the chart since 2014.
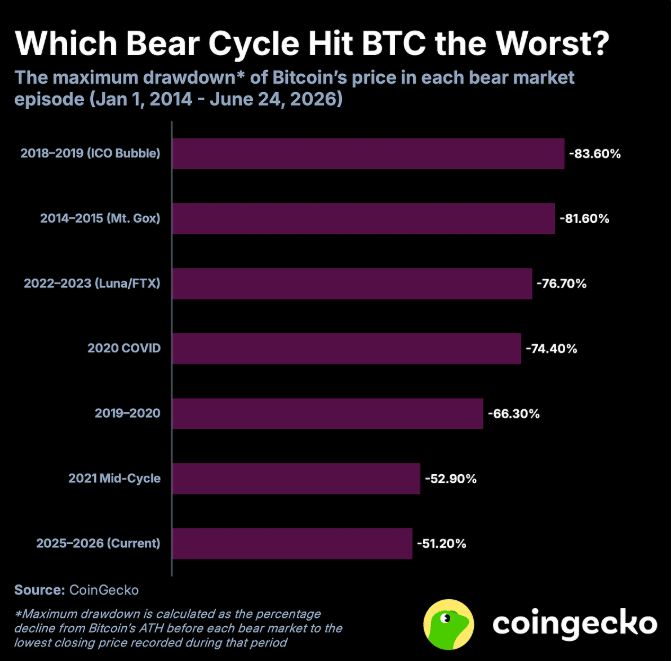
Diving deeper into the current cycle, the correction has been relatively moderate. CoinGecko chart below shows that BTC’s current 51.20% drawdown from its ATH to the July low is smaller than the declines recorded during previous major bear-market cycles.
In 2018–2019, the Initial Coin Offering (ICO) bubble saw an 83.60% correction in the Crypto King’s value, while earlier corrective phases also recorded drawdowns over 74%. By comparison, the current 2025-2026 decline is more like the mid-cycle corrections seen in 2021, which recorded a 52.90% fall, than a full-scale market breakdown.
These more moderate drawdowns suggest that BTC market structure has evolved from its earlier speculative profile into an institutionally participated asset class. The launch of 11 US spot Bitcoin Exchange Traded Funds (ETFs) in January 2024 further accelerated this integration by providing regulated, exchange-traded access to BTC for investors and institutions.
The catalyst came from the US Treasury
Bitcoin price action coiled for over a month in July after hitting a yearly low of $57,800 on July 1, consolidating in a quiet and nervous range while waiting for a fresh catalyst. One came, totally unexpectedly, from the US Treasury.
In mid-August, the Treasury announced it would at least double the size of certain debt buyback operations. This is not just noise or a temporary market fluctuation. The move is a structural liquidity shift that can significantly impact risky assets. Cryptos were one of the first markets to respond, given their sensitivity to shifts in global liquidity.
When the US Treasury buys back its own debt, it indirectly injects cash into the financial system. That liquidity doesn’t necessarily sit idle, as investors generally redeploy it in search of higher returns. In that scenario, more capital could move from safer assets to riskier ones, supporting cryptocurrencies.
Bitcoin tends to respond first as a liquidity barometer, and it did: it gained nearly 25% in August, hitting $83,300.
Institutional demand comeback
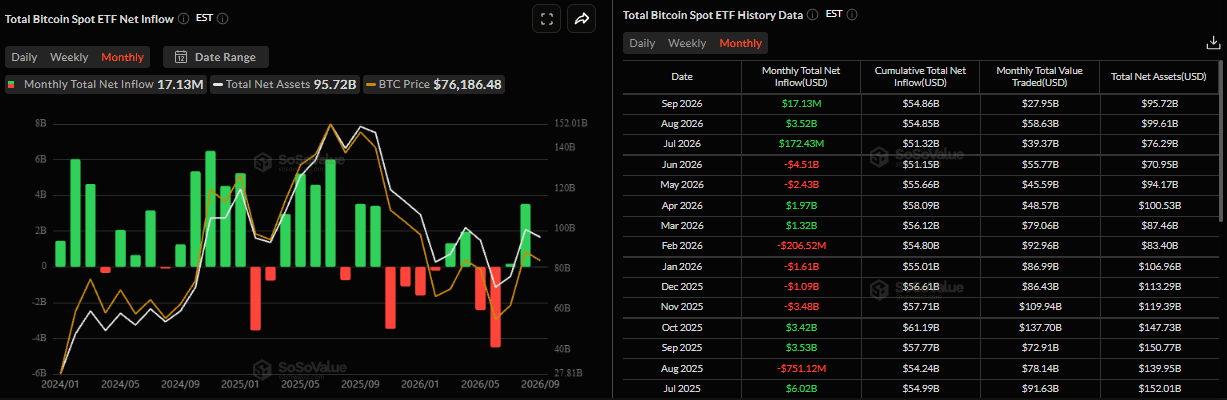
SoSoValue data shows institutional demand has improved from the heavy outflow period earlier in 2026, but the recovery remains relatively weak and inconsistent. US spot Bitcoin ETFs staged a strong rebound, recording $3.52 billion in net inflows in August, the best month of the year, and continuing with mild inflows so far in September. Persistent institutional buying through these financial vehicles has helped absorb selling and stabilize BTC.
Strategy (MSTR), the Bitcoin treasury company led by Michael Saylor, has also resumed BTC accumulation. The firm bought 4,603 BTC for approximately $370 million between August 24 and 30 at an average price of $80,318 per Bitcoin. The purchase marks Strategy’s first confirmed BTC acquisition since late June and lifts its total holdings to 845,050 BTC. The move suggests Saylor’s company may be returning to its familiar approach of aggressively accumulating BTC after spending much of the summer strengthening its liquidity position. The return of a major corporate Bitcoin buyer could also become relevant for the broader BTC market structure. Strategy has historically acted as a natural source of demand, and a sustained return to accumulation could provide an additional tailwind for the Crypto King.
September seasonal weakness in play
Historically weak September seasonality could continue to weigh on BTC. Seasonal data shows a cautious outlook for BTC in September, with Bitcoin historically averaging losses of nearly 3%.
September started with several key risks, facing a double headwind from the CLARITY Act setback and a hawkish Federal Reserve (Fed) outlook.
The long-awaited Digital Asset Market Clarity (CLARITY) Act failed to advance in the US Senate on September 15, with a 49-50 vote falling short of the 60 votes needed to invoke cloture – the formal Senate procedure used to break gridlock and move legislation toward a final vote.
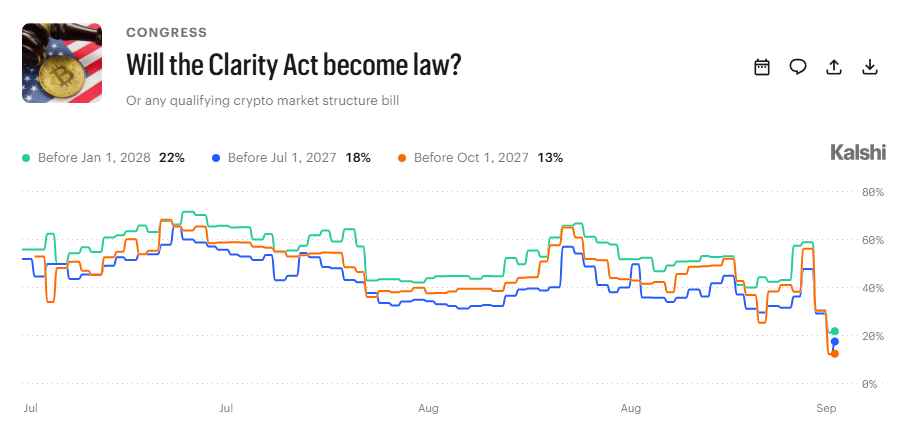
The setback was immediately reflected in Kalshi’s market probabilities for the CLARITY Act’s becoming law. The odds of passage by January 1, 2028, dropped to around 20% from 59%, while expectations for approval by October 1, 2027, declined to 13% from 58%, and those for July 1, 2027, fell to 18% from nearly 49%. This suggests traders have quickly priced in that the bill is now unlikely to pass anytime soon, reflecting the loss of momentum and the difficult path ahead through the current Congress.
Regulatory clarity has remained a key catalyst for the broader crypto market, but the CLARITY Act’s failure to advance in the US Senate leaves institutions and exchanges facing continued uncertainty.
In addition, on September 16, the Fed raised interest rates for the first time since July 2023. The Federal Open Market Committee (FOMC) voted unanimously to increase its target range by 25 basis points (bps) to the 3.75%-4.00% range. That ends a roughly 38-month stretch without a rate hike and formally puts monetary tightening back on the table.
September’s 25-bps hike was largely priced in, making the Fed’s future policy path more important for Bitcoin. In fact, the so-called dot plot revealed that 16 of 18 policymakers are projecting at least one additional hike in 2026.
If persistent inflation, elevated Oil prices and rising Treasury yields push markets to price in additional Fed hikes, tighter liquidity and a stronger US Dollar (USD) could weigh on BTC.
What do on-chain data show?
On-chain data shows a mixed picture for the Crypto King, with the broader market structure remaining bullish while short-term demand shows signs of cooling.
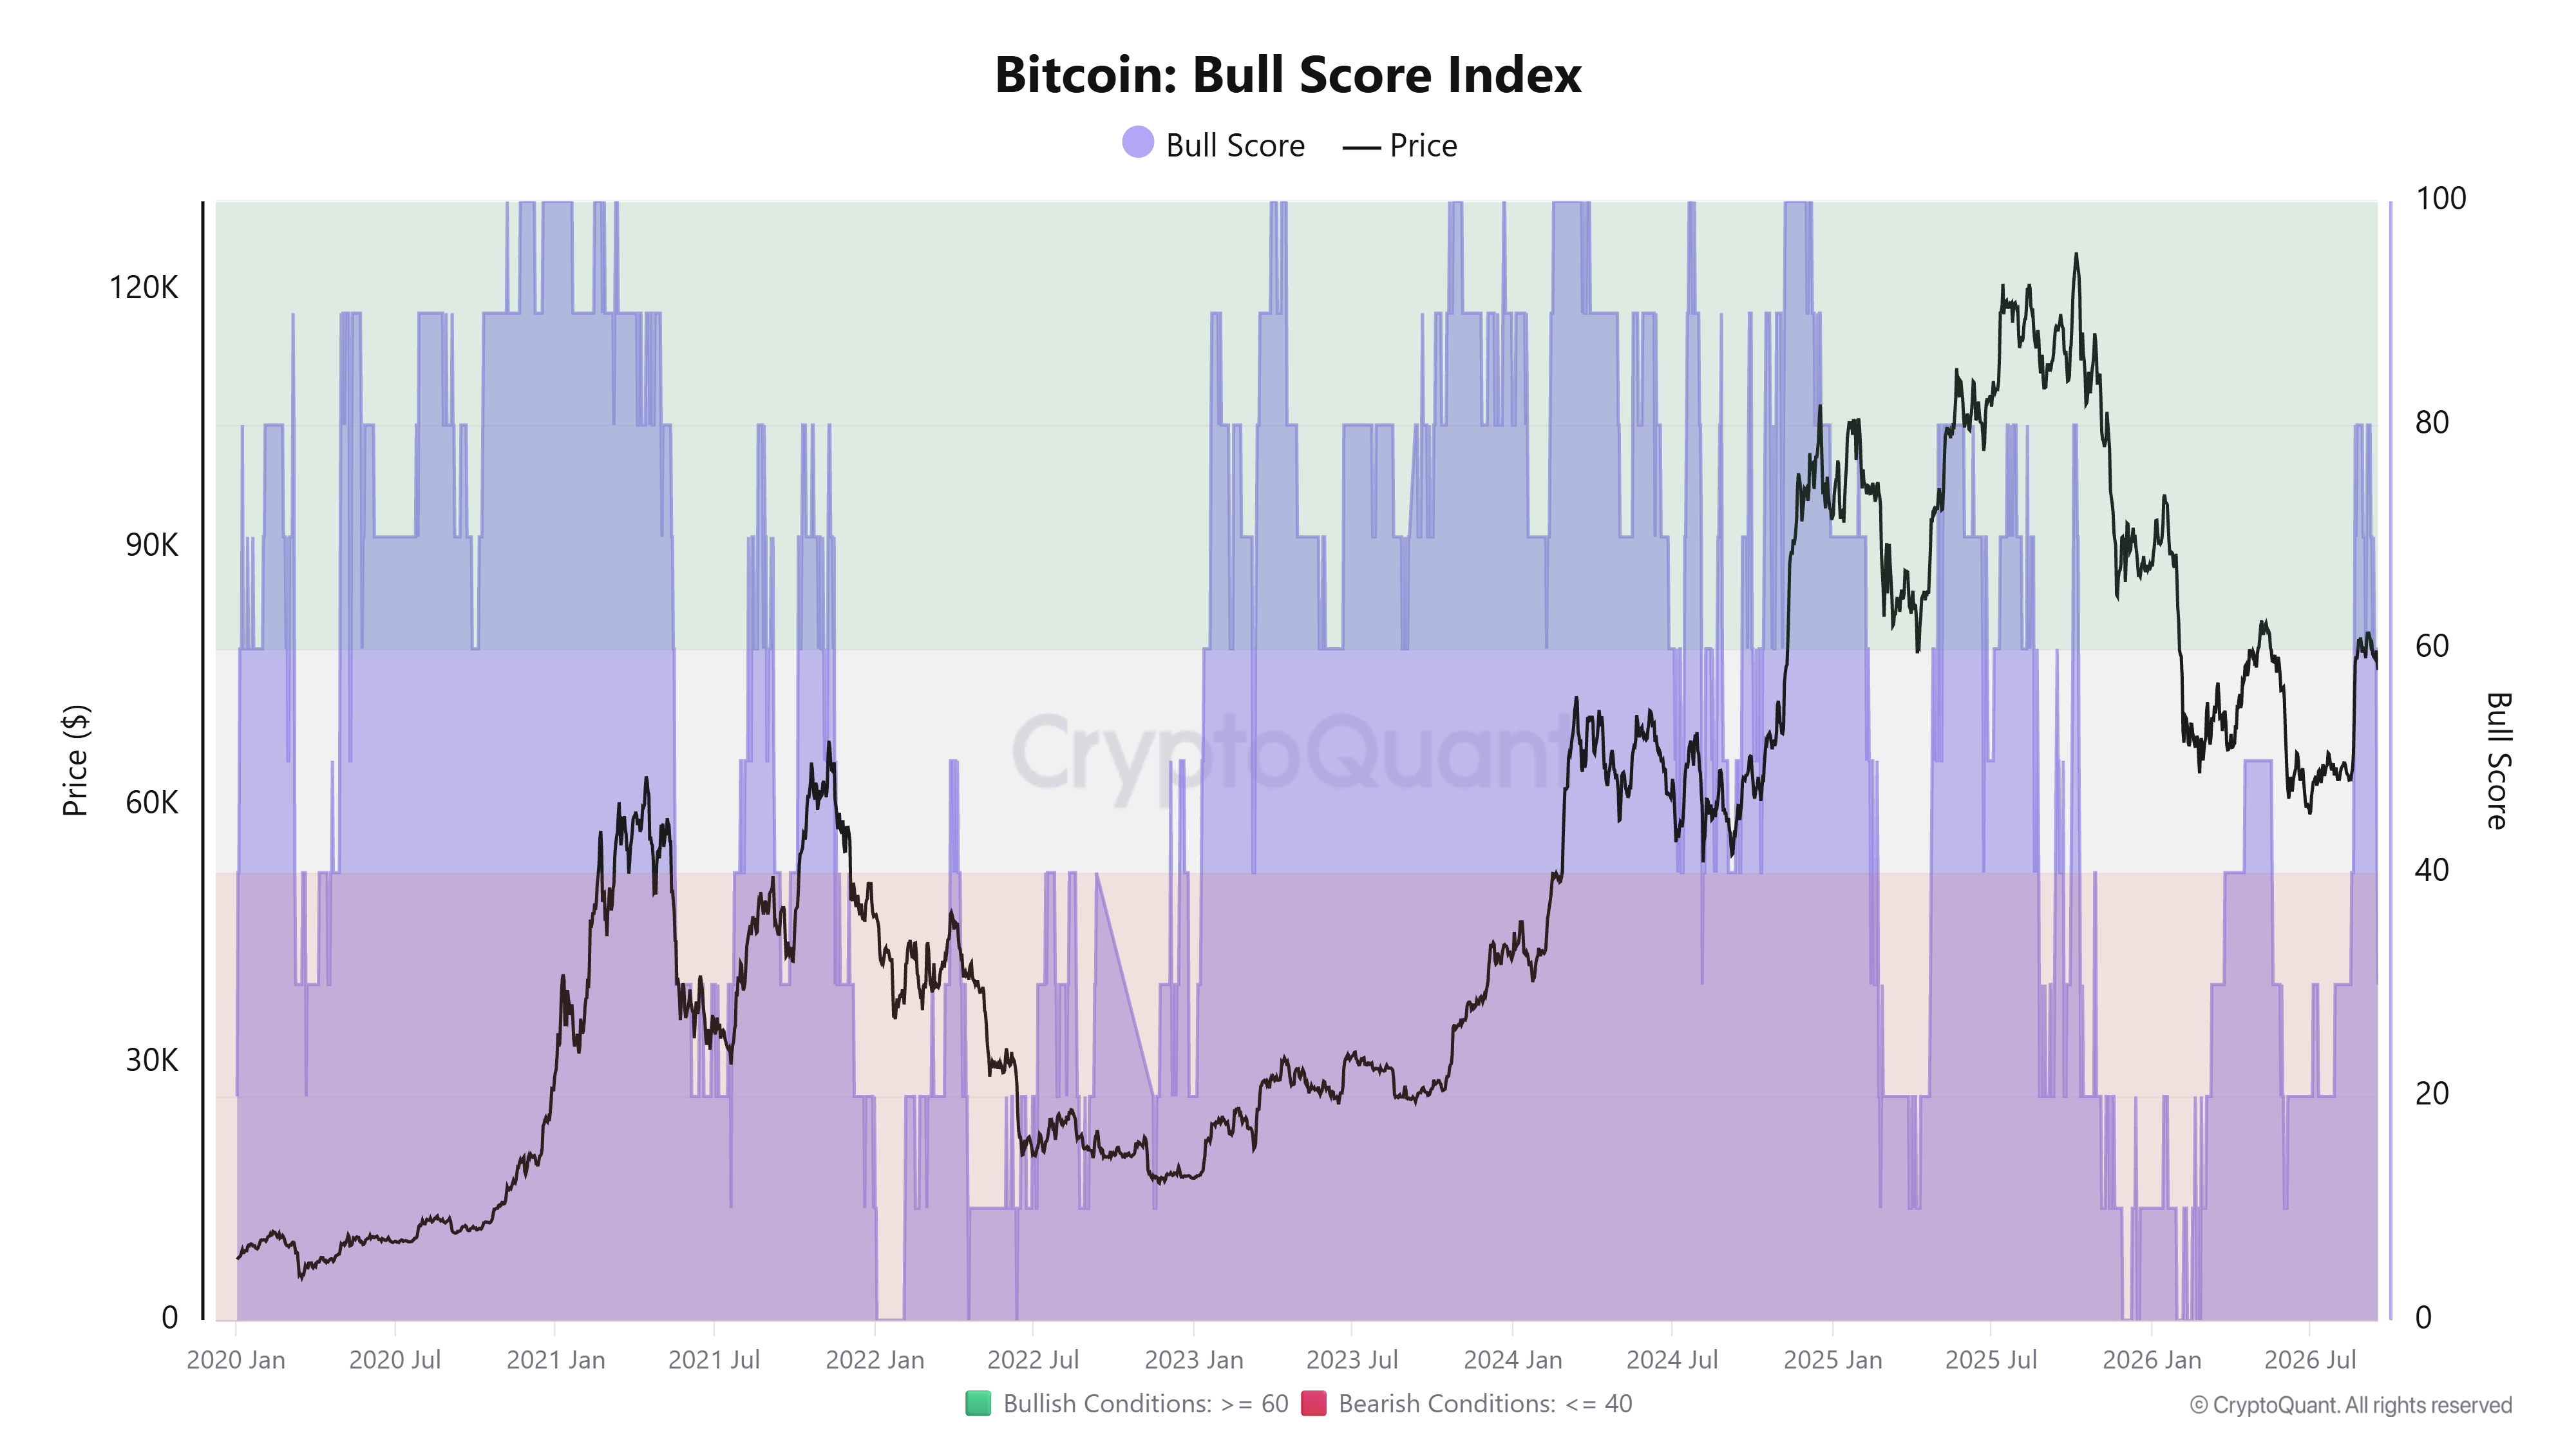
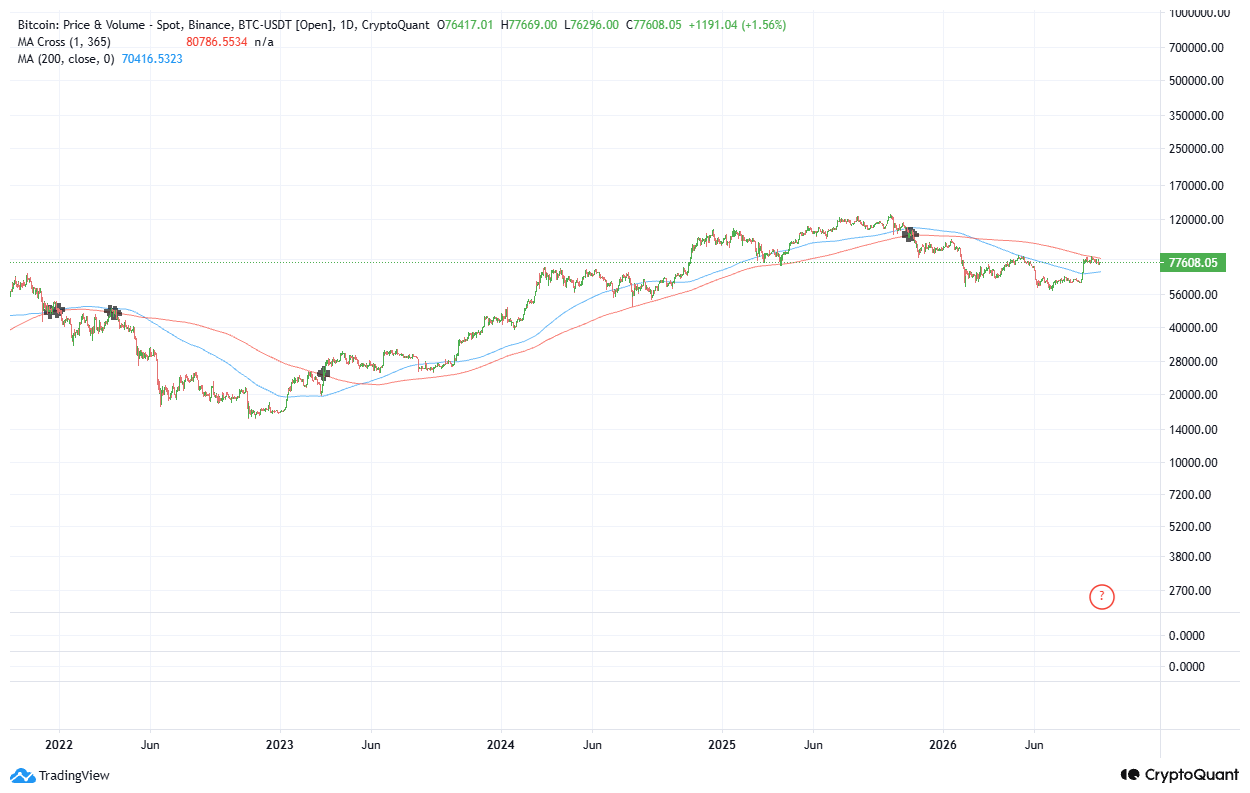
CryptoQuant’s Bull Score stands around 70, keeping BTC in bullish territory, but the August rally has stalled below the 365-day moving average around $82,300, as shown in the chart below.
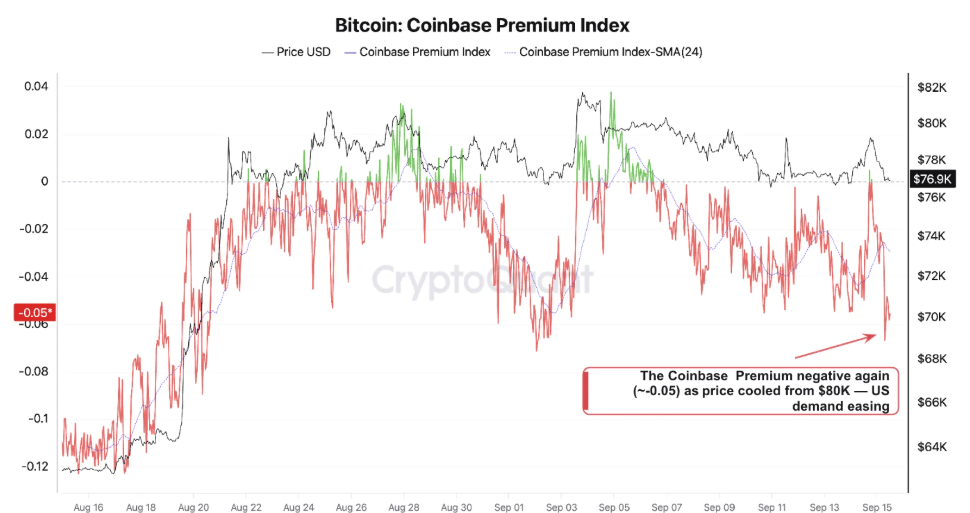
In addition, demand indicators have weakened, with apparent spot demand returning to contraction and the Coinbase Premium turning negative, pointing to softer US investor demand. Meanwhile, holders have taken profits aggressively, following a rally in August, which together indicates BTC could remain in consolidation until stronger spot demand returns.
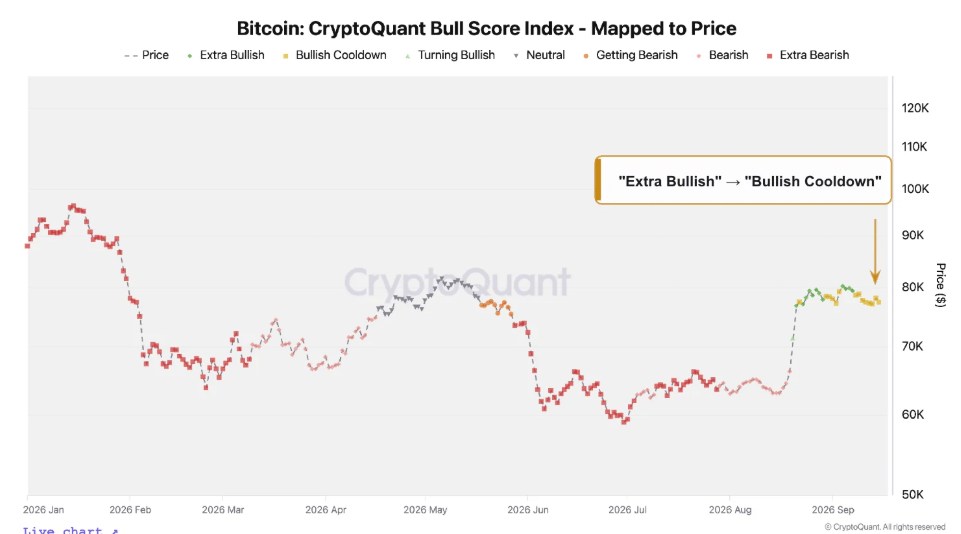
Overall, the on-chain outlook suggests a bullish cooldown rather than a confirmed trend reversal.
Conclusion: Bears or Bulls?
Bitcoin’s recovery from the July low has improved its broader market structure, but the end of the bear-market cycle remains unconfirmed.
The rebound has remained strong as BTC regained the 200-day SMA and attracted renewed institutional demand (ETFs and Strategy accumulation), while on-chain valuation remains constructive.
However, several metrics such as cooling spot demand, increasing profit-taking activity, the failed cloture vote on the CLARITY Act and the US Fed’s return to rate hikes have added fresh macro and regulatory uncertainty. Together, this suggests a consolidation phase rather than an immediate rally continuation.
Now, the key technical hurdle remains the 365-day moving average around $82,300; a sustained break above and hold would better confirm a new bullish phase, while rejection could keep BTC in consolidation or expose it to deeper downside.
Overall, the current outlook for BTC is characterized as a bullish recovery that still needs confirmation, rather than a confirmed end to the bear market. The next major signal traders should watch for is whether BTC can break above its long-term resistance at $82,300, with renewed spot demand and institutional flows providing stronger confirmation of the recovery.
Bitcoin, altcoins, stablecoins FAQs
Bitcoin is the largest cryptocurrency by market capitalization, a virtual currency designed to serve as money. This form of payment cannot be controlled by any one person, group, or entity, which eliminates the need for third-party participation during financial transactions.
Altcoins are any cryptocurrency apart from Bitcoin, but some also regard Ethereum as a non-altcoin because it is from these two cryptocurrencies that forking happens. If this is true, then Litecoin is the first altcoin, forked from the Bitcoin protocol and, therefore, an “improved” version of it.
Stablecoins are cryptocurrencies designed to have a stable price, with their value backed by a reserve of the asset it represents. To achieve this, the value of any one stablecoin is pegged to a commodity or financial instrument, such as the US Dollar (USD), with its supply regulated by an algorithm or demand. The main goal of stablecoins is to provide an on/off-ramp for investors willing to trade and invest in cryptocurrencies. Stablecoins also allow investors to store value since cryptocurrencies, in general, are subject to volatility.
Bitcoin dominance is the ratio of Bitcoin’s market capitalization to the total market capitalization of all cryptocurrencies combined. It provides a clear picture of Bitcoin’s interest among investors. A high BTC dominance typically happens before and during a bull run, in which investors resort to investing in relatively stable and high market capitalization cryptocurrency like Bitcoin. A drop in BTC dominance usually means that investors are moving their capital and/or profits to altcoins in a quest for higher returns, which usually triggers an explosion of altcoin rallies.

