
NZD/USD is testing a major area of interest after falling from its June highs!
Is the pair heading for new weekly lows? Or are we looking at a pullback opportunity?
We’re taking a closer look at the 4-hour chart!

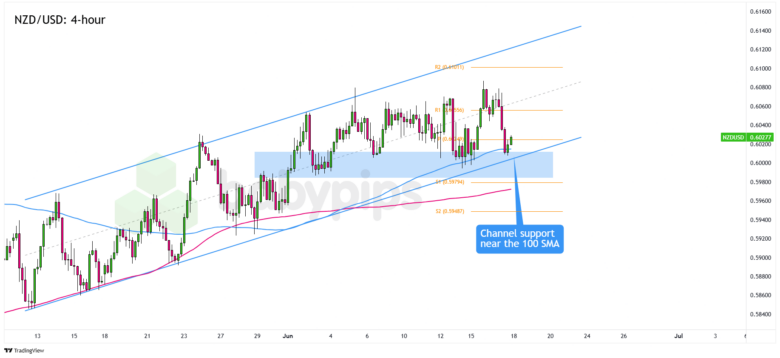
NZD/USD 4-hour Forex Chart by TradingView
In case you missed it, risk appetite took a hit as markets braced for deeper U.S. involvement in the Israel-Iran conflict. That knocked “risk” currencies like Kiwi lower, while the U.S. dollar soaked up safe haven flows and maybe a little profit taking ahead of the Fed’s big show this week.
But that was yesterday. Today, markets expect Fed Chairman Powell and his team to keep policies steady, but also hint at further easing down the road.
Will we see an anti-USD trend that would push counterparts like NZD higher?
Remember that directional biases and volatility conditions in market price are typically driven by fundamentals. If you haven’t yet done your homework on the U.S. and New Zealand dollars, then it’s time to check out the economic calendar and stay updated on daily fundamental news!
NZD/USD just came down from fresh June highs near .6080 and hit a speed bump around the .6000 handle.
That level has some teeth, sitting close to the 100 SMA and the Pivot Point at .6025 on the 4-hour chart. More importantly, the pair is trading close to the bottom of an ascending channel that’s been in play since mid-May.
NZD/USD bulls who still believe in the pair’s uptrend can position for a potential bounce from the .6000 levels and possibly a trip to the .6080 previous highs or new June highs.
But if NZD/USD goes back to printing red candlesticks and sees sustained trading below .6000, then we should be on the lookout for a possible move to the S1 (.5979) Pivot Point or the 200 SMA area on the chart.
Whichever bias you end up trading, don’t forget to practice proper risk management and stay aware of top-tier catalysts that could influence overall market sentiment!
Disclaimer:
Please be aware that the technical analysis content provided herein is for informational and educational purposes only. It should not be construed as trading advice or a suggestion of any specific directional bias. Technical analysis is just one aspect of a comprehensive trading strategy. The technical setups discussed are intended to highlight potential areas of interest that other traders may be observing. Ultimately, all trading decisions, risk management strategies, and their resulting outcomes are the sole responsibility of each individual trader. Please trade responsibly.

