
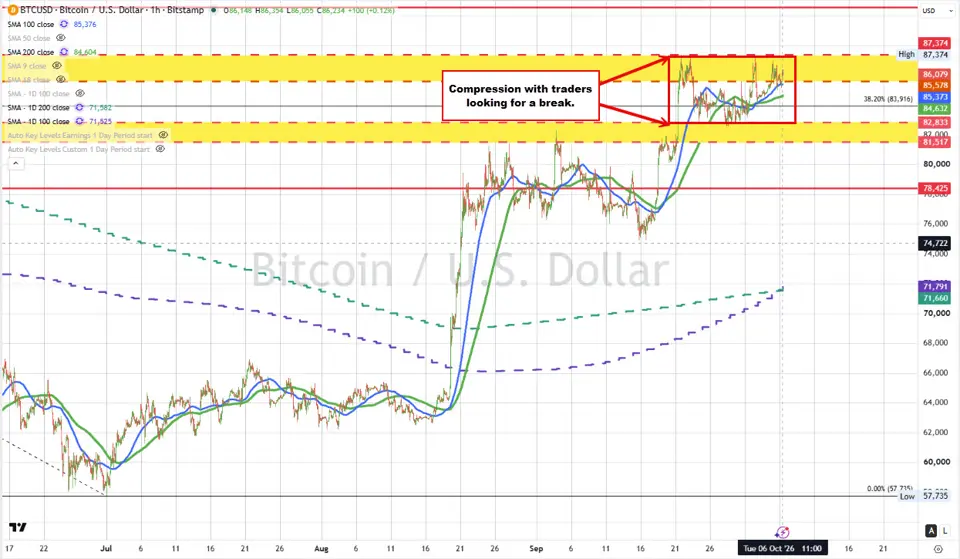
Bitcoin is trading in a narrow range so far today, with a low of $85,131 and a high of $86,375. The current price is near $86,163, toward the upper end of that range.
The buyers have a modest technical advantage. However, they still need to clear overhead resistance to give the next move higher more momentum.
In the video above, I take a detailed look at the digital currency and explain in detail the compression and what traders should be on the lookout for.
Rising moving averages support the buyers
The price has dipped briefly below its rising 100-hour moving average at $85,373, but those breaks have been modest and have failed to attract sustained selling. That suggests buyers remain willing to step in on dips.
Below that, the 200-hour moving average at $84,633 provides another support target, followed by the rising 100-bar moving average on the 4-hour chart near $84,393.
Together, those moving averages give traders a series of levels to measure the buyers’ control. Holding above them keeps the recovery intact. Breaking below them would start to take that control away.
The upper swing area remains a hurdle
On the topside, Bitcoin remains within the $85,578–$87,374 swing area that has been in play since late September.
That area also has a longer history. It acted as a floor from late December into late January before the price broke lower on January 29. An old floor can become a ceiling when the price returns to it from below, as traders use those familiar levels to sell or reduce exposure.
The buyers have worked their way back into that area. Now they need to get through the top.
A move above $87,374—and the ability to stay above it—would increase the bullish bias and open the door for further upside momentum.
Bitcoin is compressing like a spring
With rising support underneath and resistance overhead, Bitcoin’s price action resembles a spring being compressed.
At some point, that compression releases. When it does, the move can be quick as traders caught on the wrong side adjust their positions and breakout traders join the move.
The challenge is that compression does not tell us which direction the price will break. The technical levels help answer that question.
For Bitcoin, $87,374 is the key upside trigger, while a break below the support cluster extending down to $84,393 would give sellers more control. Until then, traders are waiting for the next shove.
Key technical levels
An upside break above $87,374 would have traders targeting:
-
$90,000: Natural round-number resistance.
-
$90,554: Swing high resistance from late January.
-
$92,000: The 50% midpoint of the decline from the October all-time high.
On the downside, sellers first need to break the 100-hour moving average at $85,373, followed by the 200-hour moving average at $84,633 and the 4-hour chart’s 100-bar moving average near $84,393.
Below that support, the next targets are:
-
$83,916: The previously broken 38.2% retracement.
-
$81,517–$82,833: A lower swing area.
-
$81,404: The rising 200-bar moving average on the 4-hour chart.
Trader education: A break needs follow-through
For newer traders, the lesson is that a brief move through a technical level is only the first step. The price needs to stay beyond that level and attract follow-through.
Today’s modest dips below the 100-hour moving average show why that matters. Sellers had an opportunity, but they could not build momentum.
The same test applies at $87,374. Break above and hold, and buyers strengthen their case. Break above and fall back below, and the buyers may have had their shot—and missed.
Know the levels before the spring releases. They help you define your risk, limit your risk and judge whether the next shove is gaining traction.

