
The Australian Dollar (AUD) gains ground against the US Dollar (USD) at around 0.6845, trading 0.2% higher to near 0.6878 in the Asian trade on Wednesday. The AUD/USD pair trades higher as the Australian currency outperforms its peers; however, the outlook of the pair remains uncertain amid fears of aggressive Federal Reserve (Fed) monetary tightening.
Hotter-than-expected United States (US) Consumer Price Index (CPI) data for October has prompted fears of a bigger interest rate hike by the Fed in the December policy meeting.
On Tuesday, the Bureau of Labor Statistics (BLS) reported that the headline Consumer Price Index (CPI) grew at a faster pace of 0.4% Month-on-Month (MoM) against 0.3% estimates. In the same period, the core CPI – which excludes volatile food and energy items – arrived at 0.3%, higher than expectations of 0.2%.
Fed Governor Christopher Waller said before the US CPI data release that a “half-point Fed rate hike may be needed in December, if October core CPI inflation comes in around 0.3% or higher.”
According to the CME FedWatch tool, the odds of the Fed hiking interest rates by 50 basis points (bps) to the 4.25%-4.50% range have emerged at around 9%, which were not even in existence before the data release.
The US Dollar has also outperformed after hot US CPI report release, with the US Dollar Index (DXY) holding onto its Tuesday’s gains around 102.25 as of writing.
On the Aussie front, Westpac-Melbourne Institute Consumer Sentiment Index for November has come in at 78.2, down from 80.4 in October. This is the weakest reading since late 2022. Consumer sentiment in Australia has been deteriorated due to higher interest rates and heightened inflationary pressures.
AUD/USD Technical Analysis
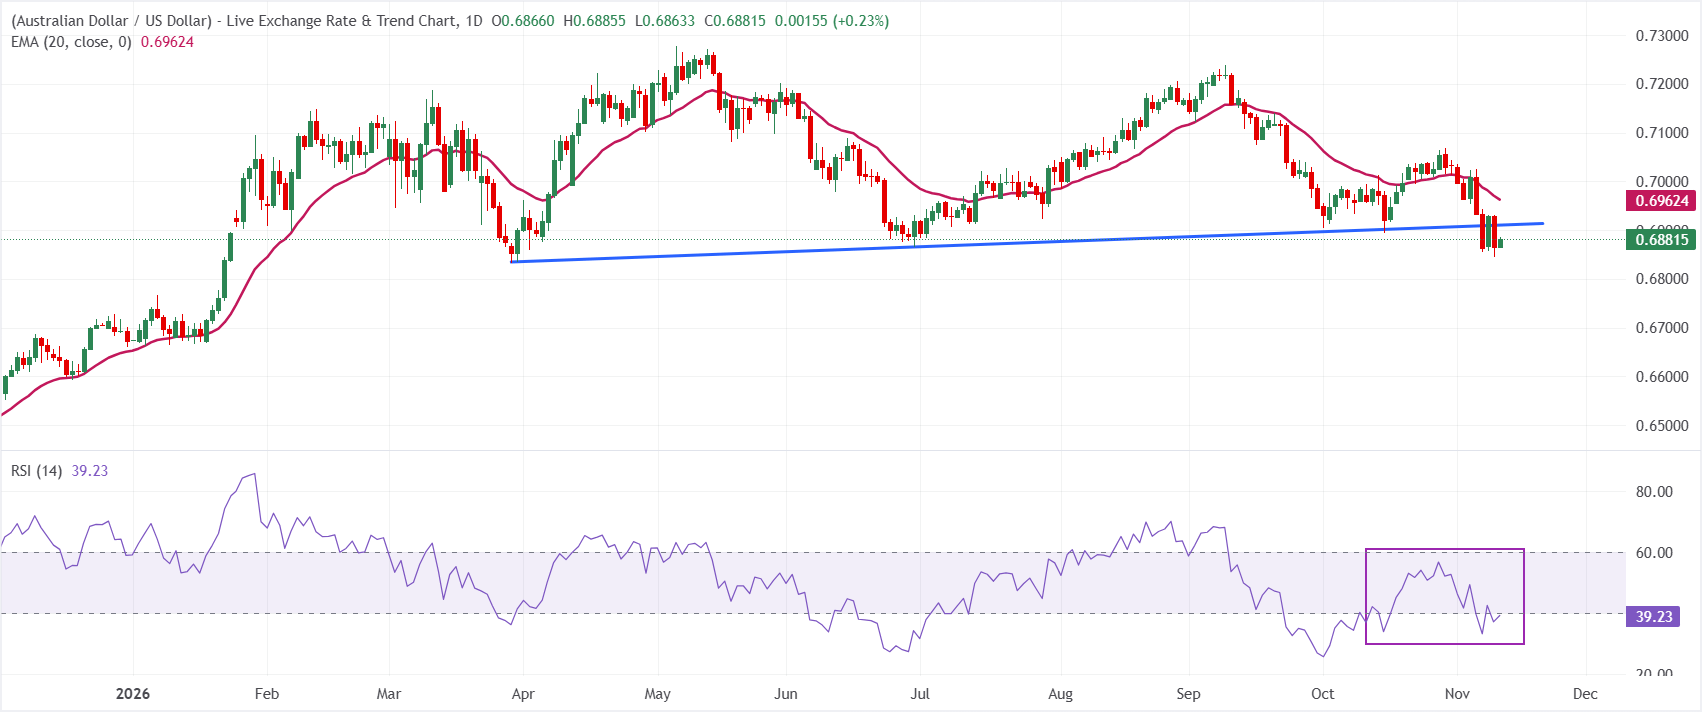
In the daily chart, AUD/USD trades at 0.6881, keeping a bearish near-term bias after slipping below the former upwards trend-line support at 0.6910 and remaining capped by the 20-day Exponential Moving Average (EMA) near 0.6962. The pair trades under these key reference levels, suggesting rallies are likely to face supply, while the Relative Strength Index (RSI) around 39 stays below the neutral 50 mark, hinting that downside momentum is softening but still favors sellers.
On the topside, initial resistance is now seen at the broken trend-line support around 0.6910, with a stronger cap at the 20-day EMA near 0.6962, where a daily close above would be needed to ease immediate bearish pressure. On the downside, the lack of well-defined indicator-based supports below spot leaves the pair vulnerable to further declines, with traders likely to watch for fresh price action floors forming closer to recent lows to gauge whether sellers can extend control or if a corrective rebound starts to build.
(The technical analysis of this story was written with the help of an AI tool. Know more.)
Economic Indicator
Consumer Price Index ex Food & Energy (MoM)
Inflationary or deflationary tendencies are measured by periodically summing the prices of a basket of representative goods and services and presenting the data as the Consumer Price Index (CPI). CPI data is compiled on a monthly basis and released by the US Department of Labor Statistics. The MoM print compares the prices of goods in the reference month to the previous month.The CPI Ex Food & Energy excludes the so-called more volatile food and energy components to give a more accurate measurement of price pressures. Generally speaking, a high reading is seen as bullish for the US Dollar (USD), while a low reading is seen as bearish.