
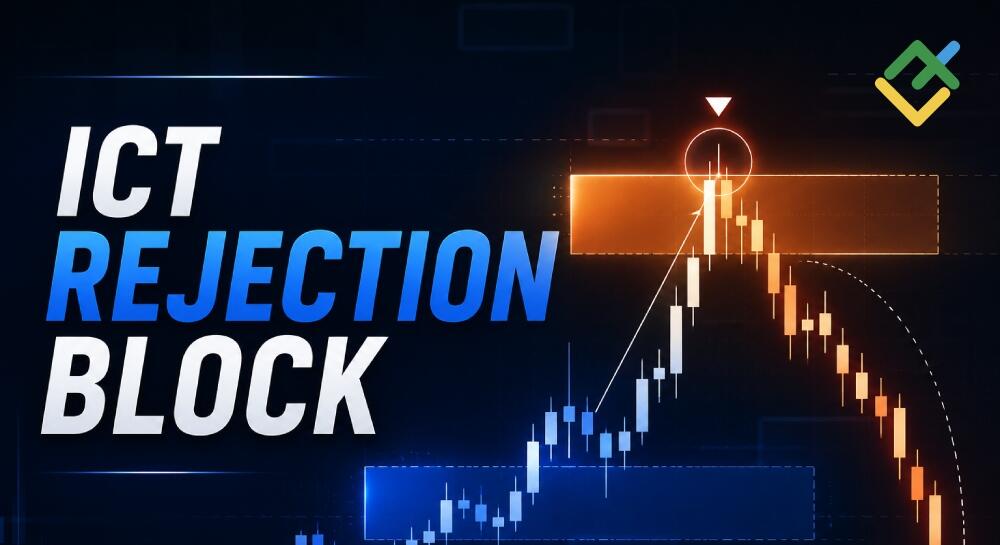
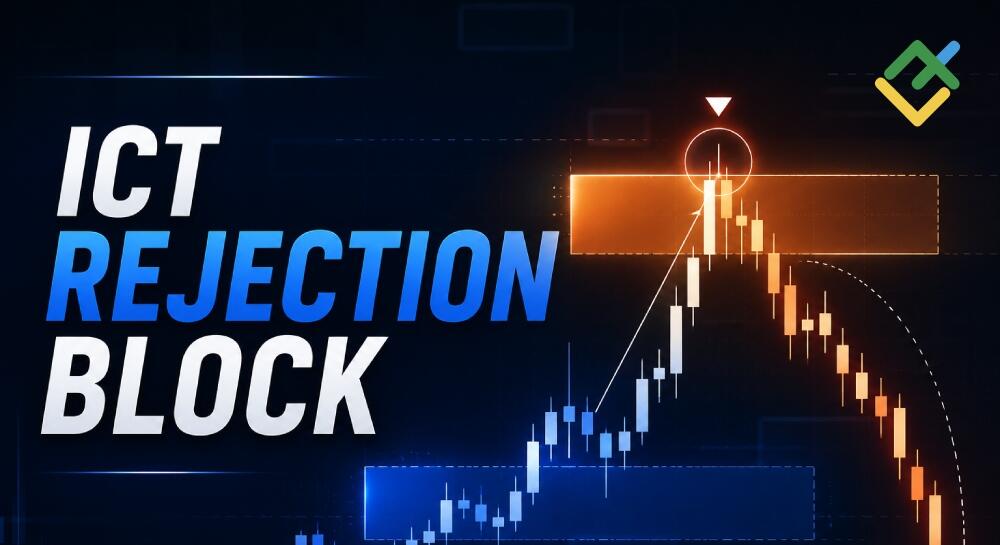

The ICT Rejection Block is a price action pattern employed in the Inner Circle Trader (ICT) and Smart Money Concepts (SMC) trading methods. It is defined by a candlestick with a prominent wick. Since the pattern is easy to identify and comes with clear trading rules, novice traders use it in their strategies to pinpoint entry points.
This article explains what the ICT Rejection Block is, how it forms, how to spot it on a chart, and how to use it effectively.
The article covers the following subjects:
Major Takeaways
-
The ICT Rejection Block is a part of the Inner Circle Trader trading system, developed by Michael Huddleston.
-
The pattern consists of a single candlestick with a long wick. This extended wick shows that the price initially moved strongly in one direction before market sentiment shifted abruptly, driving the price back in the opposite direction.
-
There are two types of blocks: bullish and bearish. In a bullish block, red candlesticks appear first, forming a long lower shadow, and then the price begins to rise. In a bearish block, the opposite occurs. In trading terminology, these setups are commonly referred to as bullish ICT rejection and bearish ICT rejection patterns.
-
The entry zone is defined by two price levels. For a buy setup, it lies between the closing price of the last bearish candle and the low of the wick on the candlestick that forms the bullish rejection block. For a sell setup, the entry zone is between the closing price of the last bullish candle and the high of the wick on the candlestick that forms the bearish rejection block.
-
The ICT Rejection Block is most effective on time frames ranging from H1 to D1 and is best applied in markets where reliable trading volume data is available.
-
To improve entry precision and optimize stop-loss placement, many breakout traders refine their entries on lower time frames. For example, if a rejection block forms on the H1 chart, they may switch to the M5 chart and wait for a confirming Price Action signal.
What Is an ICT Rejection Block?
A Rejection Block is a reversal candlestick pattern used in Inner Circle Trader (ICT) methodology that signals a potential sharp change in the price direction. The pattern is also widely incorporated into Smart Money Concepts (SMC) trading approaches.
ICT and SMC are closely related market analysis frameworks. ICT is the original methodology, while SMC represents a simplified interpretation and adaptation of its concepts by the trading community.
The ICT Rejection Block Strategy highlights a sharp market structure shift and provides traders with a potential entry point and a clearly defined stop-loss level. In essence, a rejection block identifies an area where price has strongly rejected a specific range. These setups often allow traders to enter positions with a high risk-to-reward ratio, typically 2:1 or higher. Although rejection blocks occur relatively infrequently, they can provide high-quality trading opportunities.
Rejection blocks can be found in various financial markets, including stocks, Forex, cryptocurrencies, and commodities. To filter out false signals, traders should rely on trading volume data.
How Rejection Blocks Form in the Market
The ICT methodology distinguishes between Buy-Side Liquidity (BSL) and Sell-Side Liquidity (SSL). Buy-side liquidity is found above swing highs, where stop orders from sellers tend to accumulate. Sell-side liquidity is located below swing lows, where buyers’ stop orders are concentrated. A liquidity sweep—when price briefly moves beyond one of these liquidity zones before reversing sharply—often precedes the formation of a rejection block. In ICT terminology, this move is commonly referred to as an ICT liquidity sweep or liquidity grab.
Equal highs, equal lows, support and resistance levels, and supply and demand zones help traders identify areas where liquidity is likely to accumulate. ICT also incorporates the concepts of premium and discount zones. A discount zone is generally favored for long positions, while a premium zone is preferred for short positions.
Let’s examine the principles behind the formation of rejection blocks:
-
The price moves against the main trend.
-
The price tests a key level, such as a previous swing high or low, or an important daily or weekly level.
-
Major players accumulate liquidity near this level.
-
A rejection occurs, with the price reversing sharply. The move often covers a significant distance in a short period and is accompanied by increased trading volume.
-
A rejection block forms as a candlestick with a long wick. In classical technical analysis, this type of candlestick is often called a false breakout.
-
When the price revisits the rejection block, traders may look for confirmation to enter in the direction of the prevailing trend and capitalize on trend continuation.
Most importantly, a rejection block shows a distinctive candlestick with a long upper or lower wick, depending on the direction of the reversal. These candlesticks are easy to identify because of their long rejection wicks, which represent the extent of price rejection: the longer the wick, the stronger the rejection signal.
Bullish vs. Bearish ICT Rejection Block
A rejection block can be bullish or bearish. A bullish rejection block provides an entry point to buy, while a bearish one provides an entry point to sell. Let’s take a look at how each of them forms.
Bullish ICT Rejection Block
A bullish rejection block forms as follows:
A bullish ICT Rejection Block typically forms after a bearish move. The price declines and tests a significant support or liquidity level before buyers step in aggressively. As selling pressure fades, the candlestick closes with a long lower wick. The closing price and the low of the last bearish candlestick before the reversal serve as boundaries of the bullish rejection block.
Once the pattern is established, traders wait for price to revisit the Rejection Block. If the zone holds and price resumes its upward movement, the setup may provide an opportunity to enter a long position.
Bearish ICT Rejection Block
Here’s how a bearish rejection block forms:
A bearish ICT Rejection Block forms after a bullish move. The price tests a key resistance before reversing sharply, leaving a candlestick with a long upper wick. The rejection block is defined by the closing price of the last bullish candlestick before the reversal and the high of the rejection candle.
After the pattern forms, traders wait for price to retest the block. If it holds as resistance, they look for opportunities to enter short positions.
How to Identify Rejection Blocks on a Chart
ICT rejection blocks are relatively easy to find on a chart. First, locate areas where price reverses sharply, either at major turning points or local swings. Then look for a candlestick with a long wick, which signals strong rejection of higher or lower prices. Sometimes, the reversal may span multiple candles, but the block is still defined by the extreme of the rejection candle and the closing price of the last opposing candle.
A long wick implies that the price briefly reached a new extreme but then reversed in the opposite direction under pressure from buyers or sellers. Next, confirm that the price continues moving in the new direction. A stronger signal is typically supported by increased trading volume and a shift in market structure following a liquidity sweep.
Once all factors align, you need to highlight a rectangular area:
The example below shows a rejection block on the ETH/USD weekly (W1) chart. The signal becomes more reliable when the block forms at a key support or resistance level or within a liquidity zone:
Many traders see similarities between Rejection Block and Order Block setups, and their observations are well-founded.
Differences between a rejection block and an order block:
-
A rejection block is formed by a candle with a long wick, and its range is defined by the closing price and the extreme value.
-
An order block is the range of a single specific candle; a long wick does not matter.
How to Trade an ICT Rejection Block Setup
The ICT Rejection Block is a relatively rare setup, but it complements other ICT concepts such as ICT Fair Value Gaps (FVGs) and Order Blocks. Imbalances (FVGs) can serve as high-probability Points of Interest (POI). If a rejection block aligns with an FVG, it adds strength to the level. Combining rejection blocks with other setups significantly improves the effectiveness of a trading system.
A rejection block should not be viewed as a standalone candlestick pattern. Instead, it is most effective when analyzed alongside market structure, liquidity context, and other ICT concepts.
Now let’s look at the rules for trade entry, stop-loss placement, and take-profit targets.
Entry Rules
A trader identifies an ICT rejection block on a chart. For example, a clear pattern formed on the BTC/USD chart on July 6, 2026. This is a real market example:
A long wick alone is not enough to identify a rejection block. The pattern must be followed by a sharp reversal, confirming that the market has changed direction.
Next, wait for the price to retrace into the rejection block. As it returns to the zone, observe how the market reacts. If the price enters the area and remains within it, additional confirmation is needed.
A trader can place a limit order at the upper boundary of the range, at the midpoint, or at the opposite boundary. However, the most effective entry point can be identified with additional analysis.
The entry point is refined on a lower time frame. For example, if a pattern has formed on the H1 chart, it’s best to examine the entry in more detail on the M5 chart.
There are various ways to refine the entry. For example, you can wait for a confirmed breakout of the 50 EMA on the 5-minute chart and then enter:
In the example above, point 1 shows an inconclusive test of the zone. This may be due to an inaccurately drawn rejection block or minor discrepancies in price quotes. In either case, it is better to wait until the price settles in the zone, as it does at point 2. At point 3, the price breaks through the 50 EMA but fails to hold above it, leading to another decline to point 4. Finally, at point 5, the price pierces the 50 EMA again and holds the move, providing a confirmation signal to enter the market.
You can use any confirmation method that fits your trading strategy. The key is to wait for confirmation that, after retesting the rejection block, the price resumes moving in the direction indicated by the pattern. Only then should the setup be considered for entry.
Stop-Loss Placement
When trading rejection blocks with a limit order, a stop-loss should be placed above the higher high of a bearish block or below the lower low of a bullish block. To reduce the risk of being stopped out by normal price fluctuations or quote discrepancies, it is advisable to add a small buffer of a few pips beyond the high or low.
If you refine your entry on a lower time frame after the price retests the rejection block, place the stop-loss beyond the most recent swing low for a buy trade or above the most recent swing high for a sell trade. Use the price structure that has formed by the time the entry signal appears to determine the appropriate stop-loss level.
Take-Profit Targets
There is no universal rule for setting a take-profit order. The optimal exit depends on market conditions, the specific trade setup, and strategy. However, the following approaches are commonly used:
-
Set the take-profit at the nearest significant swing high for long positions or the nearest significant swing low for short positions.
-
Set take-profit twice as far away as stop-loss.
-
Scale out of the position by taking partial profits.
-
Place the take-profit near a key support or resistance level.
Exit points are selected based on the available liquidity, and the risk-reward ratio is assessed before opening a position. While this approach does not guarantee profitable trades every time, it helps manage the expected value.
Here’s an example of a BTC/USD trade:
The key rule is to maintain a minimum 2:1 risk-to-reward ratio. If a trade cannot reasonably achieve a take-profit at least twice the size of the stop-loss, it is better to skip the setup.
Trading Tips
Rejection blocks are most effective when traded in the direction of the prevailing trend. Higher timeframes help identify market bias: look for buying opportunities in an uptrend and selling opportunities in a downtrend. Without considering the trend, the probability of a winning trade is 50%, just like with any other approach. When trading with the trend, you can expect 55–65% of trades to be successful.
A bullish bias following a lower wick supports a buy scenario. A bearish bias following an upper wick supports a sell scenario. Notably, a long wick alone is not enough—the reversal should be confirmed by subsequent price action.
The pattern is most commonly traded on the H1 and H4 time frames, where market noise is lower. Higher time frames are useful for identifying the broader trend, while the pattern itself can form on any chart. Market conditions also affect the reliability of the signal. Therefore, as usual, the final decision rests with the trader.
All rules of the ICT trading system also apply to the rejection block pattern, since it is an integral part of the methodology.
Conclusion
An ICT Rejection Block is a valuable price action pattern that appears relatively infrequently across all financial markets and time frames.
Using ICT rejection block involves spotting a long candle wick, signaling strong rejection of higher or lower prices. Traders then wait for confirmation of the reversal and a retest of the rejection block before looking for an entry in the direction of the prevailing trend. A long wick alone is not a valid trading signal—confirmation from price action is essential.
The content of this article reflects the author’s opinion and does not necessarily reflect the official position of LiteFinance broker. The material published on this page is provided for informational purposes only and should not be considered as the provision of investment advice for the purposes of Directive 2014/65/EU.
According to copyright law, this article is considered intellectual property, which includes a prohibition on copying and distributing it without consent.

