

US Crude Oil spot (WTI): Arc cycle analysis
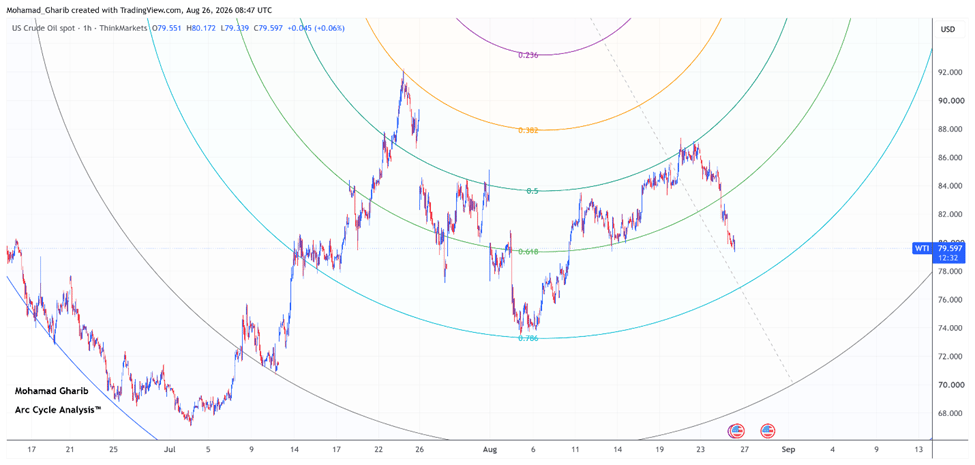
Overview: Based on Arc Cycle Analysis applied to the 1h chart, US Crude Oil Spot is interacting with the 0.618 Support Arc within the current Arc Cycle. Price is breaking this Support Arc, suggesting the potential for a bearish breakdown toward the next Support Arc.
|
Metric |
Reading |
|
Market Bias |
Bearish Acceleration |
|
Preferred Scenario |
Decline Toward the Next Support Arc |
|
Primary Target Zone |
77.30 |
|
Scenario Invalidation |
Sustained close above 82.00 |
|
Current Arc Level |
Support Arc (0.618) |
|
Cycle Status |
Testing Support Arc |
|
Arc Integrity |
Weakening |
Market outlook
Price is breaking the 0.618 Support Arc, where continued selling pressure may result in a breakdown toward the next Support Arc. A sustained breakdown below the Support Arc would support continued movement toward the next Support Arc at $77.30 (0.786 Arc).
Conversely, failure to achieve a sustained 1h close below the Support Arc would invalidate the bearish scenario and could shift the outlook toward the next Resistance Arc.

