

USD/JPY is still consolidating after the strong rally from the wave B low near 152.96, and the structure still looks like wave (iv) of an incomplete five-wave advance.
On the 2-hour chart, waves (i), (ii) and (iii) already look complete, and the latest sideways price action fits a triangle for wave (iv). Triangles usually show up late in a trend and often precede one more push higher, so as long as that reading holds, more upside is what I would be looking for in the next few sessions.
A fresh push higher in US yields would help that case, and hawkish FOMC minutes could be the catalyst. In that scenario USD/JPY could easily move closer to 160. That area also marks the earlier wave A high around 160.47, so I see 160 as major resistance for this pair. Japanese authorities have previously warned that intervention is possible near these levels, which is another reason to treat 160 as an important zone where upside may become limited if we get there.
Based on the Elliott Wave principle, more upside remains possible as long as the market trades above 154.75. That is the bullish invalidation on the chart. A break below it would reopen the bearish alternatives.
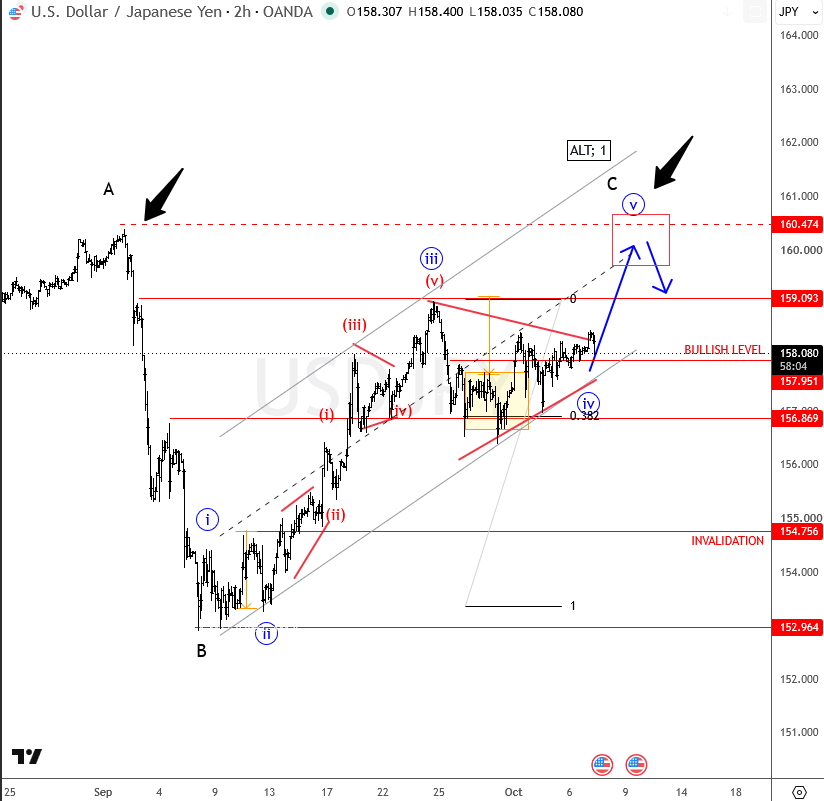
So the plan stays simple: watch the triangle resolve higher toward the 160 area, keep 154.75 as the line in the sand, and stay respectful of intervention risk near the highs.
Get Full Access To Our Premium Elliott Wave Analysis For 14 Days. Click here.

