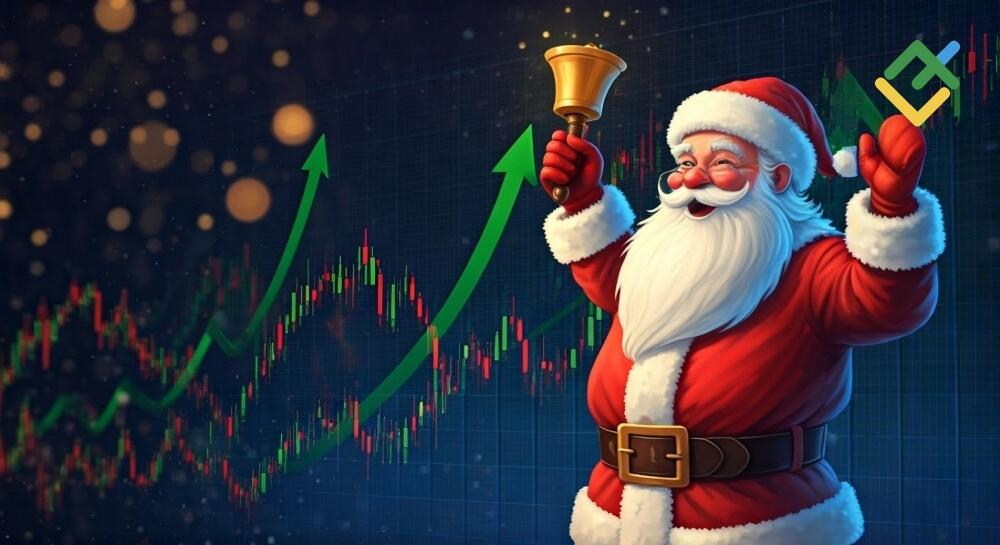
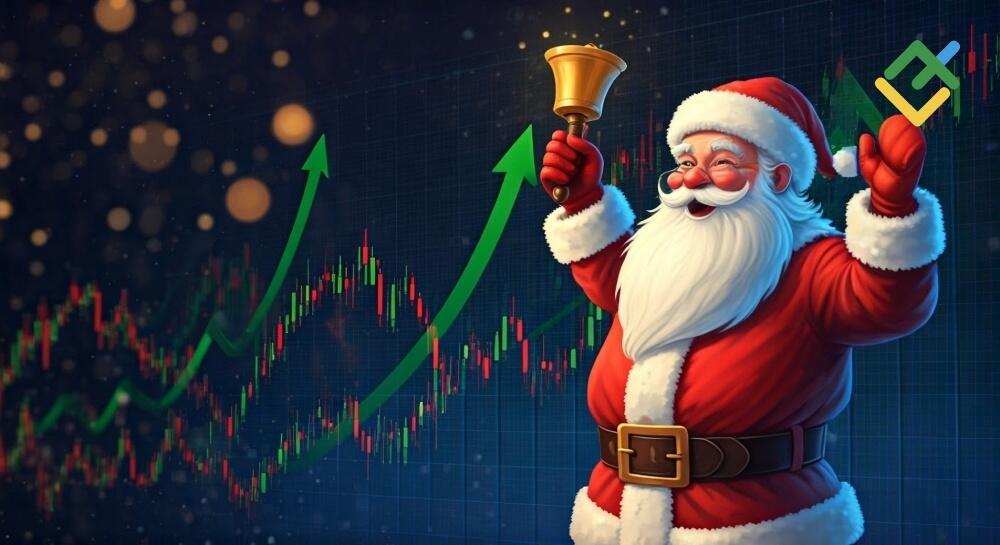

The Santa Claus rally is a seasonal pattern that traders and investors look forward to every December. First described in 1972, it now draws attention in both the stock and crypto markets. Its track record is impressive, as the S&P 500 has risen during this period 79% of the time.
In recent years, however, the pattern has started to falter, forcing analysts to rethink their forecasts. Thus, knowing what drives the market higher helps investors make smarter decisions instead of following the crowd.
The article covers the following subjects:
Major Takeaways
- The Santa Claus rally is the tendency for stock indices to rise during the last five trading days of December and the first two trading days of January.
- The term was coined in 1972 by Yale Hirsch, founder of the Stock Trader’s Almanac.
- Since 1950, the S&P 500 index has risen during this period 79% of the time, with an average gain of 1.3%. The Nasdaq has performed even better, with an average return of around 1.8%. However, past performance does not guarantee future results. Keep this in mind when developing any trading strategy.
- Historically, the S&P 500 has delivered a positive average return in the year following a Santa Claus rally. When it failed to appear, the market was often weak or falling.
- The rally failed to appear in both 2024 and 2025. Two misses in a row are not a reason to panic, though. Investors may simply have priced in much of the good news ahead of time.
- In the crypto market, Bitcoin has posted gains before Christmas in 8 of the past 11 years and after Christmas in 6. However, it is far more volatile than the stock market.
What Is the Santa Claus Rally?
The Santa Claus rally refers to a tendency for stock indices to rise over the last five trading days of the year and the first two trading days of the new year.
Think of the market as a shopping mall the day before New Year’s Eve, with just a few shoppers left, all in a festive mood and ready to spend. The stock market works the same way. With fewer traders active, liquidity is low, and even small purchases can push prices up. That is why buying by major players can easily drive the Santa Claus rally.
Like any seasonal pattern, the Santa Claus rally does not play out every year. Still, many institutional investors and traders have factored this period into their trading plans for decades, knowing that holiday optimism often lifts demand for stocks.
Santa Claus Rally History: Yale Hirsch and the Almanac
The term “Santa Claus rally” was coined in 1972 by Yale Hirsch, creator of the Stock Trader’s Almanac. After studying decades of US market data, Hirsch spotted a recurring pattern of gains in late December and early January.
Since then, the Stock Trader’s Almanac has logged how the market performs during the rally each year. According to its data, the S&P 500 has gained during this seven-day period 79.45% of the time since 1950, with an average return of 1.3%.
Yale Hirsch also came up with a well-known saying, later repeated by his son, Jeffrey Hirsch:
“If Santa Claus should fail to call, bears may come to Broad and Wall.”
The saying points to the rally’s predictive value. When it fails to appear, the market often pulls back in the following year. Once a sustained downturn begins, it makes sense to switch to a bear market strategy rather than rely on seasonal patterns.
Why Does the Santa Claus Rally Happen?
There are several theories that explain the nature of this phenomenon:
- Holiday optimism. Investors tend to feel more upbeat about the market toward the end of the year. The holiday mood and hopes for the new year set a positive market tone.
- Tax-loss harvesting. Many investors sell losing positions by December 24 to claim a tax deduction. Once these sales are complete, the freed-up money flows back into the market, boosting demand and pushing prices higher.
- Year-end bonuses. Many professionals receive bonuses at the end of the year and invest part of them. This fresh capital adds buying pressure and supports market gains.
- Low liquidity. Many traders and institutional investors are on vacation during the holidays. With lighter trading volumes, even small purchases can noticeably move stock prices.
- Institutional rebalancing. Pension funds, hedge funds, and other institutional investors review their portfolios before the year ends, which creates additional demand for certain assets.
- The January Barometer effect. The Santa Claus rally is part of a broader set of indicators that also covers the first five trading days of January. However, seasonal effects do not override broader market trends.
Santa Claus Rally in the Stock Market
The Santa Claus rally is still one of the most reliable seasonal patterns in the stock market. Since 1950, the S&P 500 has gained during this window 79.45% of the time, averaging a return of 1.3%. Over a typical seven-day period, by contrast, the index has a median return of just 0.3% and rises 58% of the time. That is more than a threefold difference, and it is hardly a coincidence.
The Nasdaq’s numbers are even more impressive. Over this period, the index gained 82% of the time, returning 1.8% on average.
The pattern does not always hold. For example, there was no rally in the 2024–2025 season or in 2025–2026, although one did take place in 2023. Two misses in a row are rare, but they are no reason to panic. According to analysts, a missing Santa Claus rally may simply mean that the market has already priced in the good news.
Past returns, however impressive, do not predict future results. Seasonal market patterns can help investors weigh the odds, but they are just one of many tools. The Santa Claus rally covers only a specific period and says nothing about what happens afterward. Thus, you can also check support and resistance levels to assess the market more fully.
Santa Claus Rally in Crypto: Bitcoin Christmas
The crypto market works differently. Assets trade around the clock, with no weekends or tax periods, but investor psychology is much the same. To see whether Bitcoin has its own Santa Claus rally, we need to look at seasonal patterns in crypto data and compare them with traditional markets.
To compare returns across different years, you can look at the same calendar dates. In the past 11 years, Bitcoin rose in the week before Christmas (December 19–25) 8 times and in the days after Christmas 6 times. As for the Santa Claus rally period itself, Bitcoin gained in 9 of those 11 years, with 2021 and 2022 as the only exceptions.
Bitcoin is far more volatile than stocks, though. Between Christmas and New Year’s, it gained 33% in 2011 and 46% in 2016, but it also fell 14% in 2014 and 10% in 2021.
In crypto, the chance of a Santa Claus rally is roughly 50–70%, compared with about 79% for stocks. Short-term traders can earn much more when it does happen. However, Santa does not visit the crypto market every year, and some years bring losses rather than double-digit gains.
In 2025, 57% of surveyed crypto traders planned to buy Bitcoin before Christmas, but analysts warned that the rally could turn out to be a bull trap. Holiday liquidity is thin, which makes the crypto market especially vulnerable to manipulation. To see whether the rally extends to altcoins, traders can check the Altcoin Season Index.
How to Trade the Santa Claus Rally
For stock traders, there are several ways to trade the Santa Claus rally and manage risk:
Basic approach (for beginners). Buy at the open on December 24 and sell at the close of the second trading day in January. Historically, this strategy has worked about 79% of the time.
Advanced approach (for experienced investors). Focus on small-cap stocks (Russell 2000). They often outperform the broader market during the Santa Claus rally, as they react more strongly to interest rate expectations and capital flows. It also helps to track individual companies instead of relying only on the index.
Options strategy. Buy call options that expire around January 3. This limits your risk while keeping the potential for strong gains.
Important. The rally did not occur during the 2024–2025 and 2025–2026 seasons. Thus, seasonal patterns are probabilities, not guarantees. Past market performance is a useful guide, but should not form the basis for investment decisions.
If you are just learning how to trade crypto, learn the basics of risk management first. Trading the Santa Claus rally in crypto can be trickier: the market stays open throughout the holidays, including weekends, and the seasonal pattern is less reliable. These are guidelines to follow:
- Monitor on-chain activity. Watch BTC inflows to exchanges in the 5–7 days before Christmas. A sharp increase may suggest that traders are preparing to sell.
- Watch for volume divergences. Rising prices on declining trading volume can signal a thin market, where price moves may be misleading.
- Allow more room for stop-losses. Low liquidity during the holidays can lead to wider spreads and slippage.
- Use the rally to assess sentiment. Many traders use this seasonal pattern to gauge overall market sentiment and adjust their positions.
Conclusion
The Santa Claus rally is one of the most widely studied seasonal patterns in financial markets. Historically, the S&P 500 has risen 79% of the time during this period, with an average gain of 1.3%. Yet, the rally may fail to materialize for several years in a row. This raises doubts about whether the pattern still holds as market conditions change.
The absence of a rally does not spell trouble for the market, but it is an important signal to reassess risks. Market conditions matter more than the time of year, and seasonal patterns offer probabilities rather than promises. In crypto, the rally is less reliable, though the gains can be larger.
Seasonal patterns can help you analyze the market, but they do not guarantee profits or replace a clear trading strategy and sound risk management. A pattern that worked in the past may not appear in the future. Year-end bonuses and other factors can strengthen or weaken the seasonal effect. Always do your own research and consider the broader macroeconomic context.
Get access to a demo account on an easy-to-use Forex platform without registration
The content of this article reflects the author’s opinion and does not necessarily reflect the official position of LiteFinance broker. The material published on this page is provided for informational purposes only and should not be considered as the provision of investment advice for the purposes of Directive 2014/65/EU.
According to copyright law, this article is considered intellectual property, which includes a prohibition on copying and distributing it without consent.