
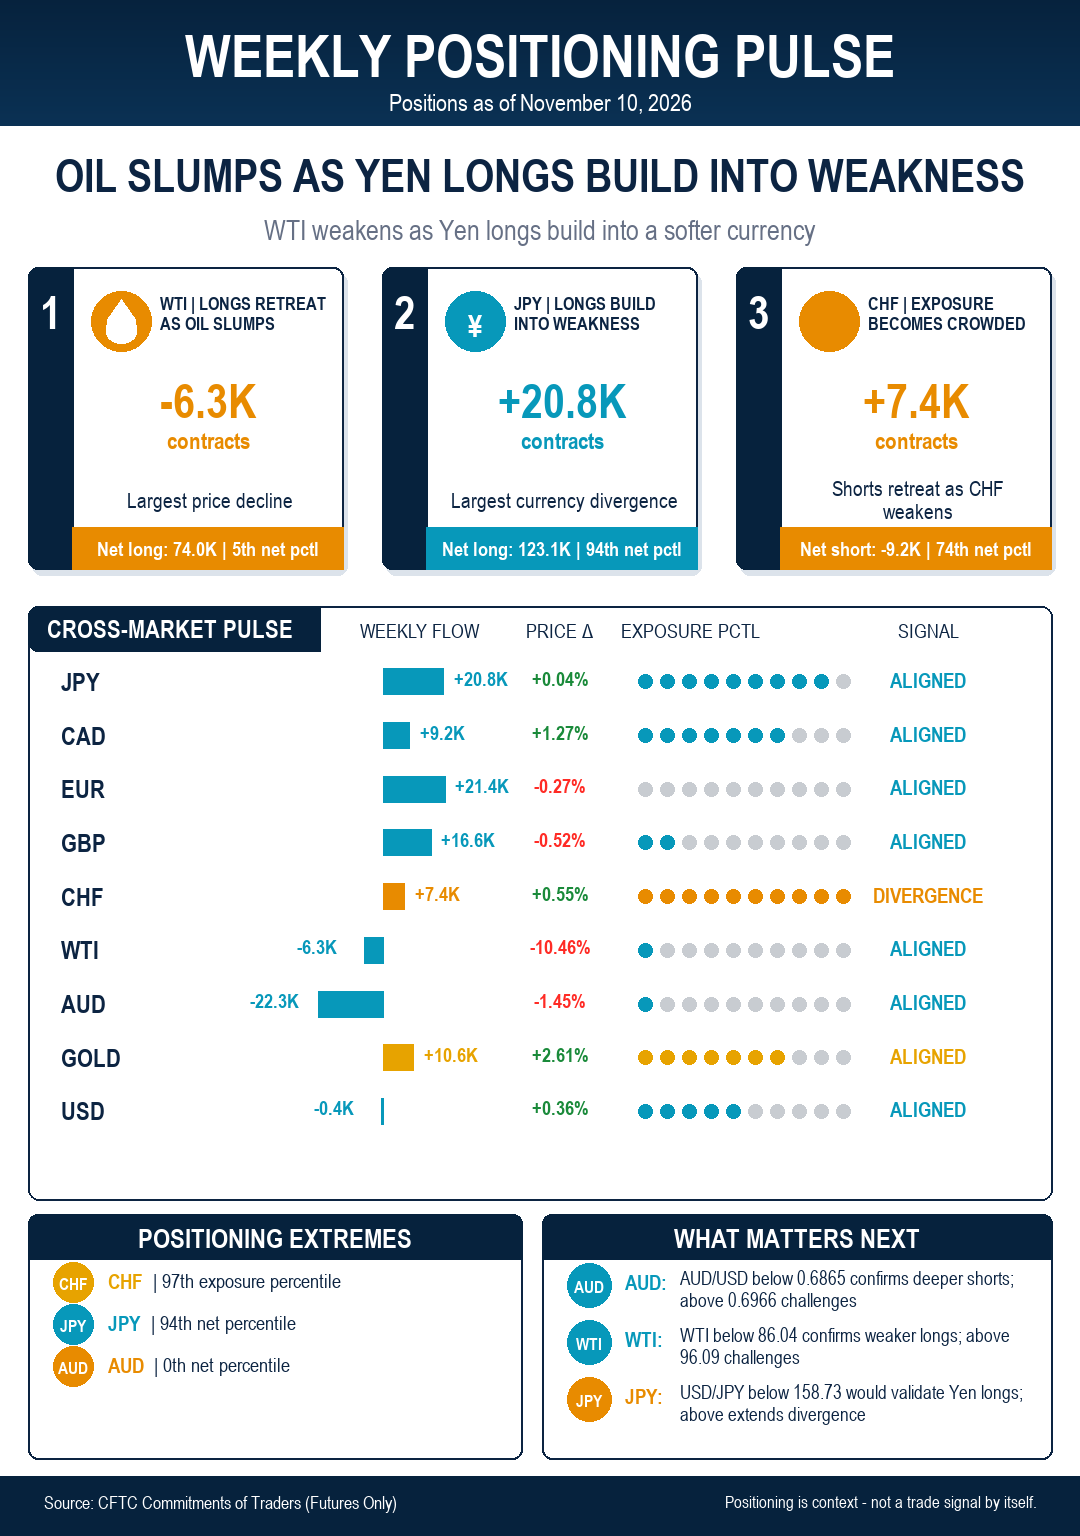
The week in one sentence: WTI slumped while speculative longs were cut in the week to November 10, and Yen longs expanded even as the currency weakened. AUD shorts deepened alongside a sharp fall in AUD/USD, while Gold buying returned and CHF exposure became increasingly crowded.
WTI: Rally outruns speculative conviction
Speculators turned less constructive on the WTI, reducing its net longs to around 74K contracts, the lowest level since mid-July. Prices of the barrel of front-month WTI (December contract) plummeted to the $86.00 region, so the market is confirming the positioning signal. In addition, exposure is near the 6th percentile and net positioning near the 5th. Further price confirmation would strengthen the move; a reversal would argue that the flow is fading.
Yen longs continued to build
Non-commercial players moved decisively towards the Japanese Yen (JPY), taking net longs to their highest level since July 2025, at around 123.1K contracts. During the period, USD/JPY advanced marginally, revisiting the 158.70 zone. Furthermore, exposure is near the 92nd percentile and net positioning near the 94th. A move in the positioning direction would validate the signal; continued price action against it would deepen the divergence.
Price and positioning are still at odds
The clearest mismatches were in JPY, the Swiss Franc (CHF) and the British Pound (GBP). Yen longs expanded even as USD/JPY rose, while CHF short-covering and a modest GBP improvement also coincided with weaker currencies. These splits show that positioning was not translating cleanly into price; further currency weakness would favour the price signal, while reversals would give the flows more credibility.
Where the flow has confirmation
The clearest confirmation came from the Australian Dollar (AUD), WTI and Gold. AUD net shorts deepened as AUD/USD fell, WTI longs were cut as crude prices slumped, and Gold buying returned alongside a firmer metal price. These aligned moves give the flow more tactical support, although the size of the price adjustment still argues for caution.
The crowded trade
JPY is the report’s most crowded exposure, at the 92nd percentile. That does not mean a reversal is imminent, but it does mean that a turn in USD/JPY could trigger a larger adjustment because speculative exposure is already heavily concentrated in the trade. The risk is therefore one of asymmetry: the position can continue to work, but a break in momentum may generate an outsized unwind. Focus here remains on the likelihood of FX intervention by the MoF, which gains traction as spot approaches the 160.00 zone.
Positioning map
The map places JPY at the top of the exposure distribution, at the 92nd percentile, while its outright net position also ranks highest at the 94th percentile. AUD is at the opposite end of the net-positioning scale, near the 0th percentile, indicating unusually light ownership. Exposure measures how crowded a position is relative to open interest; the net percentile measures its absolute historical size. Read together, the map shows both where positioning is most concentrated and where there is most room to rebuild.