Lower yields fail to provide support
Gold is moving sharply lower despite a decline in US Treasury yields. The 10-year yield is down 5 basis points to 4.939%, a move that would normally provide some support for the precious metal. Instead, gold is trading near $3900, down roughly $120, or 3%, after reaching a session low near $3891.
That divergence is telling. Buyers have a potentially supportive move in the bond market, but they are struggling to turn it into buying momentum. When the price cannot rally on a favorable development, traders need to respect what the price action is saying.
Connecting the dots from a fundamental or interest-rate perspective may be difficult. The technicals, however, are providing a clearer roadmap.
Moving averages put sellers in control
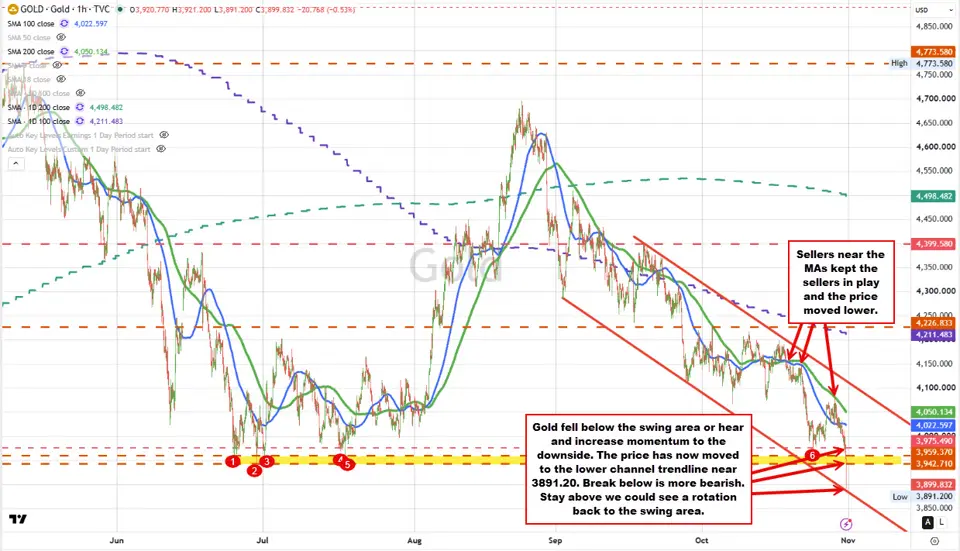
On the hourly chart, gold moved back below its 100- and 200-hour moving averages on October 19. The downside did not accelerate immediately, but those moving averages helped form a ceiling, keeping the bearish bias intact. By October 22, downside momentum began to build.
The subsequent decline took the price to $3959.37 before buyers managed a recovery. However, that rebound stalled on Wednesday near $4080, against the 200-hour moving average.
That failed recovery was an important clue. Buyers had an opportunity to challenge the bearish bias, but they could not push through a key technical barometer. Sellers could lean against the moving average with defined risk—and the subsequent rotation lower rewarded that decision.
A broken floor accelerates the decline
The next leg lower has continued into today with little sustained upside correction. Once the price broke below the $3942.71–$3959.37 swing area, selling accelerated, taking gold toward $3891.
That break matters because an established support area gives traders a reference point. Above it, buyers have a floor to lean against. Below it, those buyers face pressure to exit, while sellers gain another level against which to define risk.
The former floor now becomes a ceiling to watch on a recovery.
Channel support gives buyers a foothold
Today’s low stalled near a lower channel trendline on the hourly chart. Buyers have leaned against that support, producing a modest bounce, with the price now trading above and below $3900.
Holding the trendline gives buyers an opportunity to slow the decline and attempt a corrective recovery. It also provides a close risk level: if support breaks, the reason for buying against it weakens.
A bounce alone, however, does not change the broader bearish picture. Buyers need to reclaim resistance to demonstrate that they can take back some control.
What next? Watch support below and the broken swing area above
If buyers can keep the price above the lower channel trendline, the next upside target is the $3942.71–$3959.37 swing area. Expect that zone to act as a test of the recovery. Sellers may lean against it, while a move back above would strengthen the buyers’ case and take some pressure off the downside.
Conversely, a break below the trendline and today’s low near $3891 would open the door to another extension lower.
Sellers retain control. Buyers have support to lean against, but they still have something to prove. The trendline defines the immediate downside risk, while the broken swing area defines the next upside hurdle.
In the video above, I walk through those levels and explain how they help define the bias, risk, and targets for gold’s next move.