Ethereum price today: $2,370
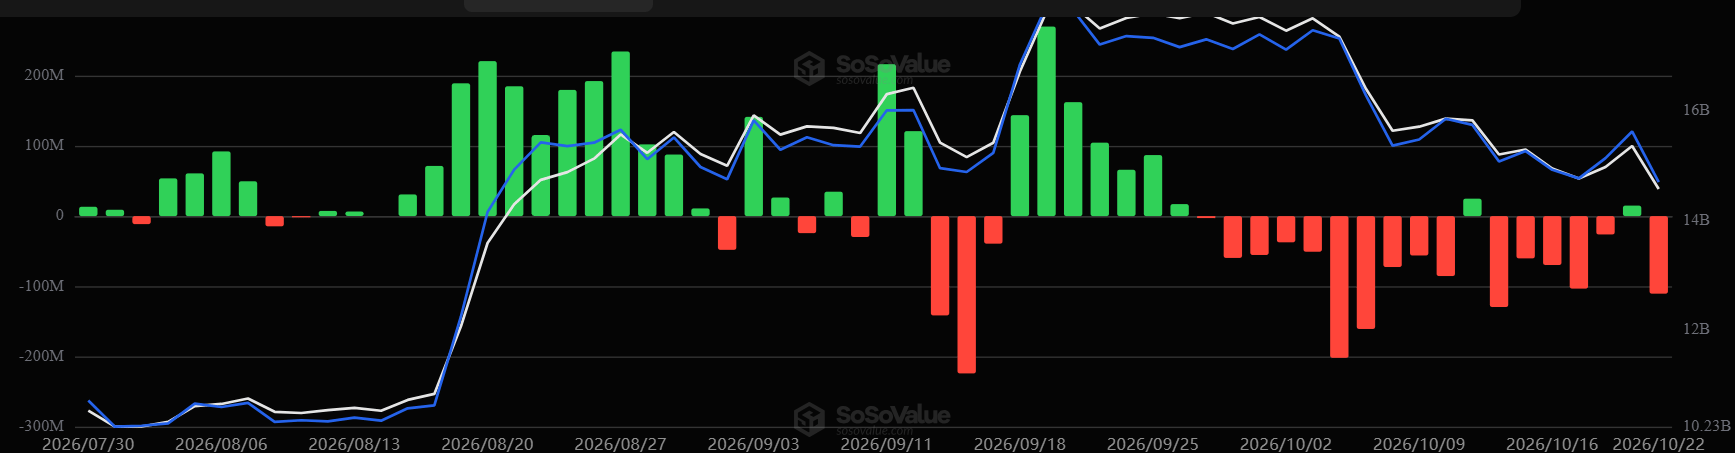
- US spot Ethereum ETFs are on track for a fourth consecutive week of net outflows.
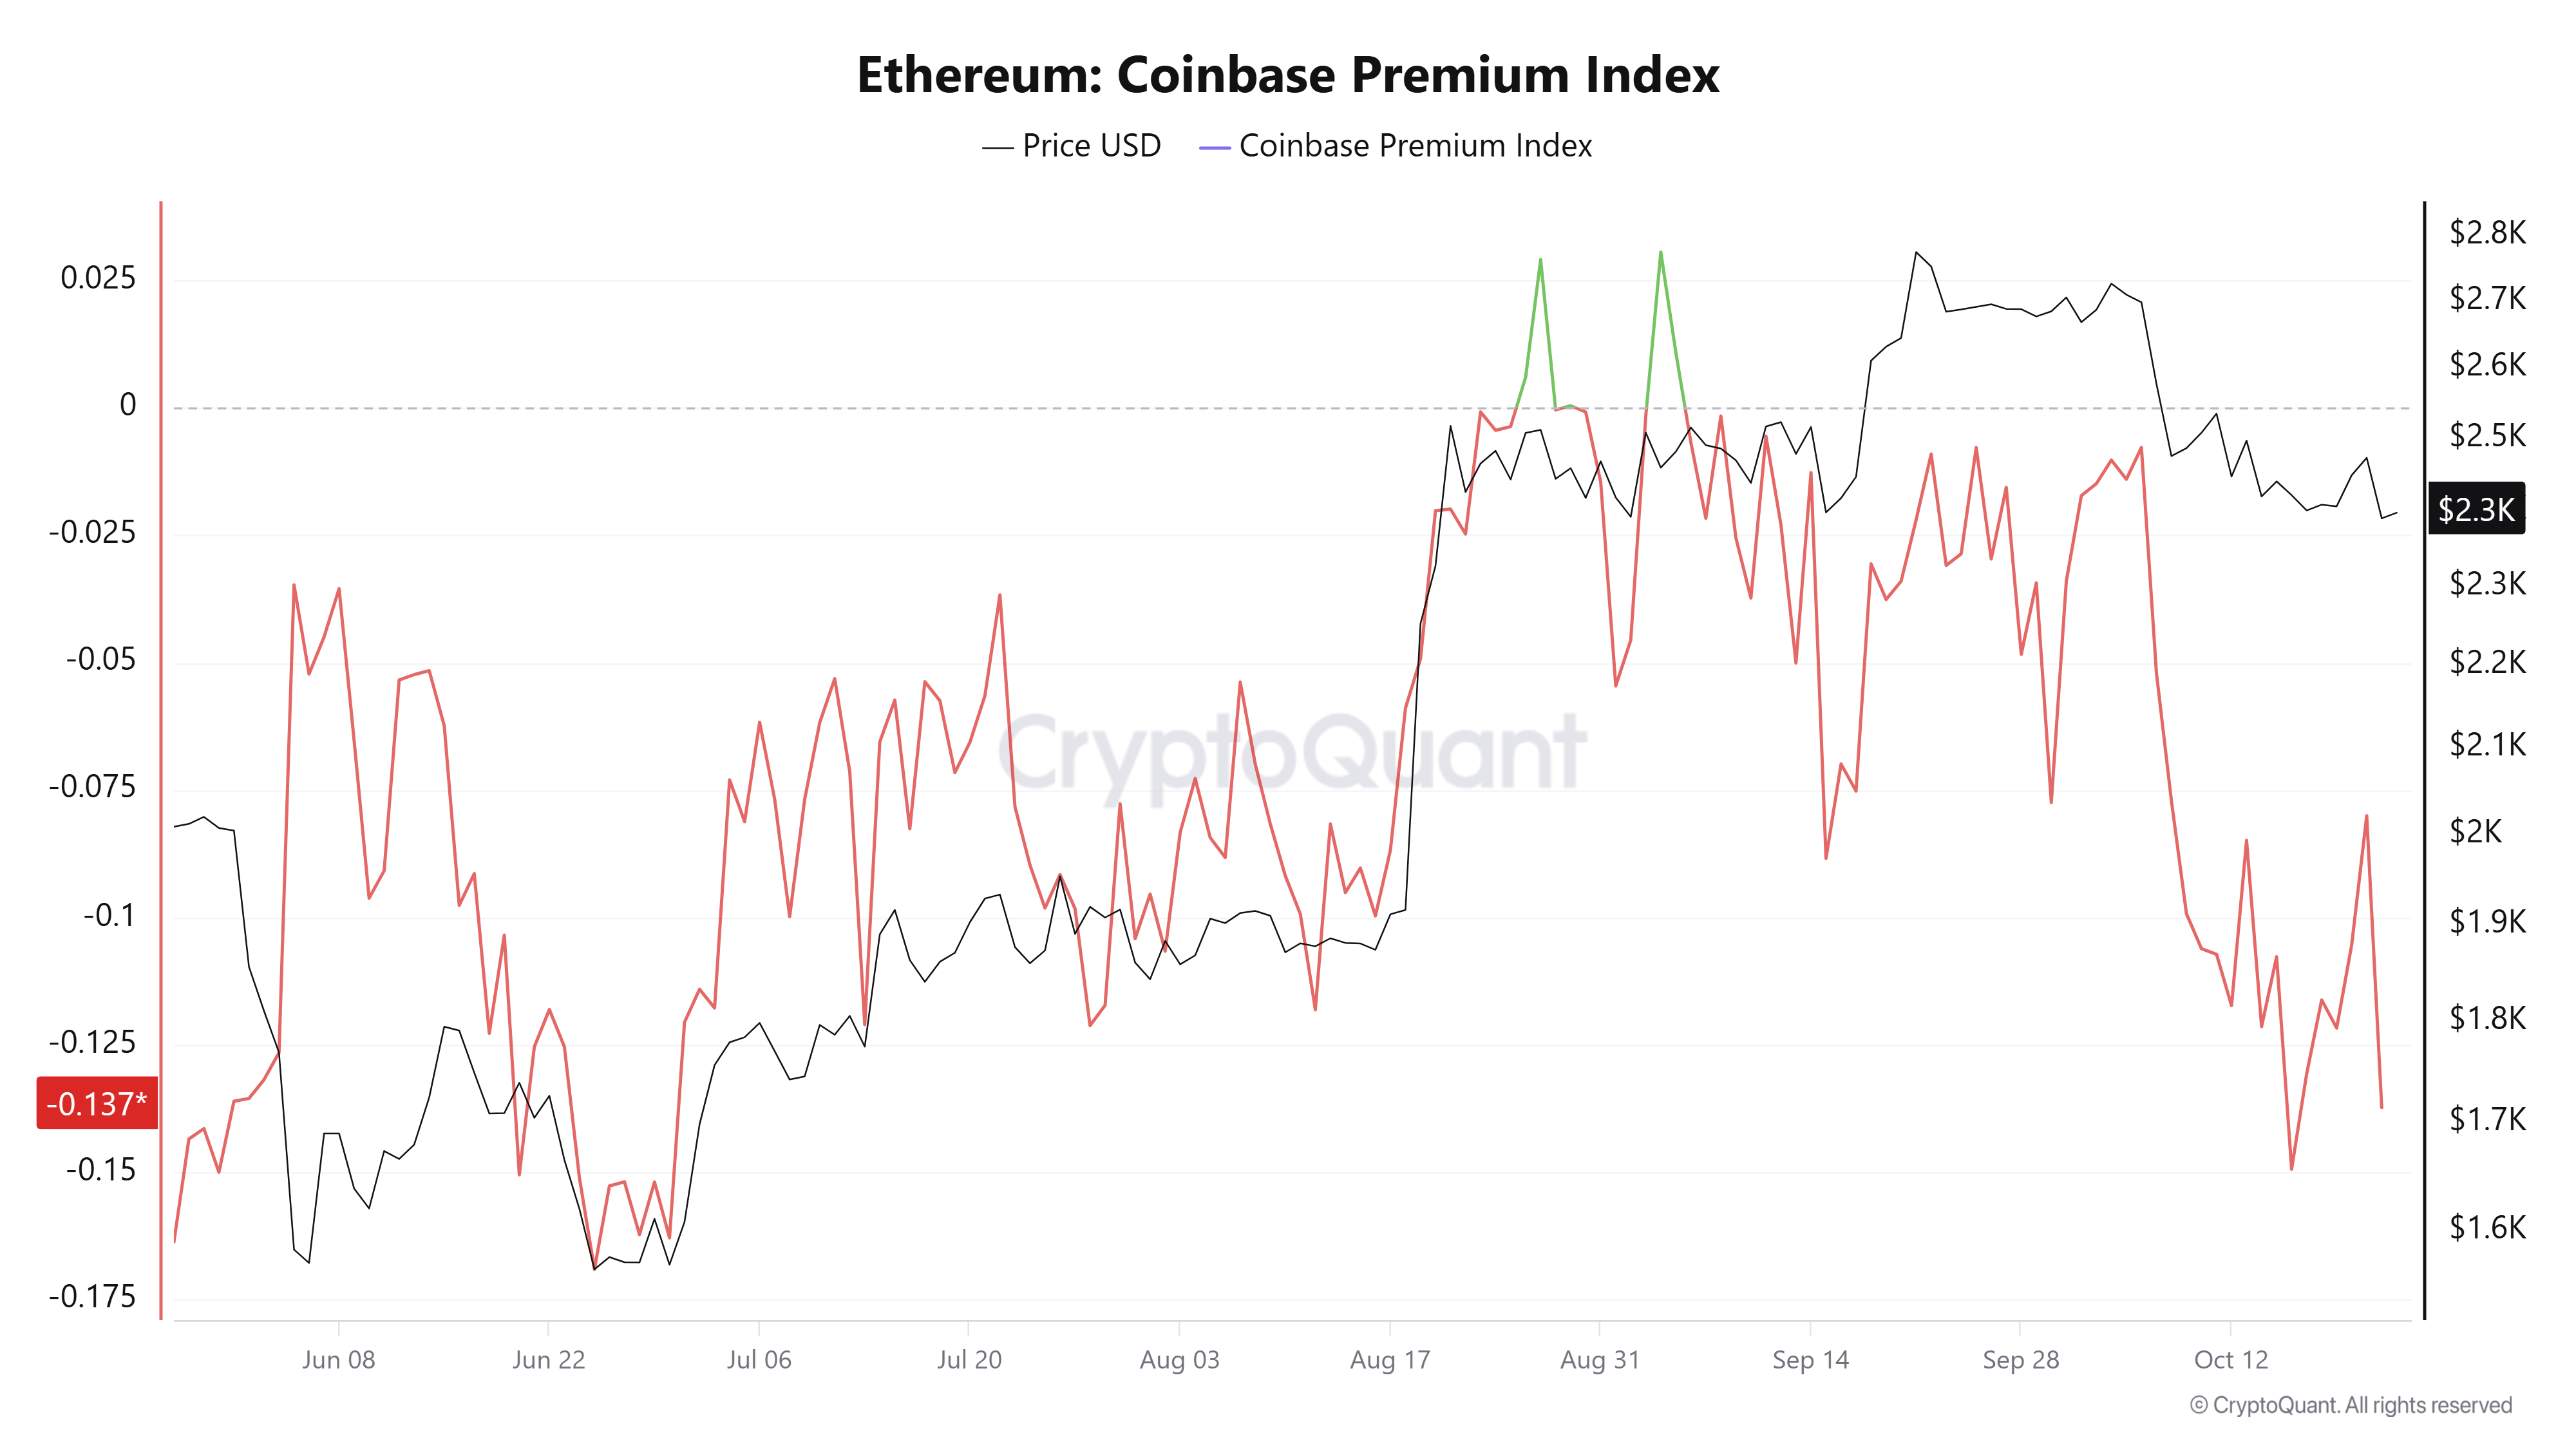
- The Coinbase Premium Index has dropped to its lowest level since June.
- ETH is testing the 100-day EMA and $2,355 support level.
Ethereum (ETH) declined below $2,400 on Friday as risk-off sentiment continues to dominate US markets.
US spot ETH exchange-traded funds (ETFs) are on track to record a fourth consecutive week of net outflows after another $110.5 million left the funds on Thursday. The products have only posted inflows twice — totaling less than $40 million — in the last 18 trading days.
A similar pattern is evident in US crypto-native trading venues. The Coinbase Premium Index, which measures the price difference between an asset trading on Coinbase Pro and Binance, is declining again after a brief rise earlier in the week.
The metric is at -0.137, its lowest level since June, when ETH established a cycle low near $1,500. Sustained negative readings mean ETH is cheaper on Coinbase than Binance, indicating relatively weaker demand or active selling from US-based markets, according to on-chain analytics firm CryptoQuant.
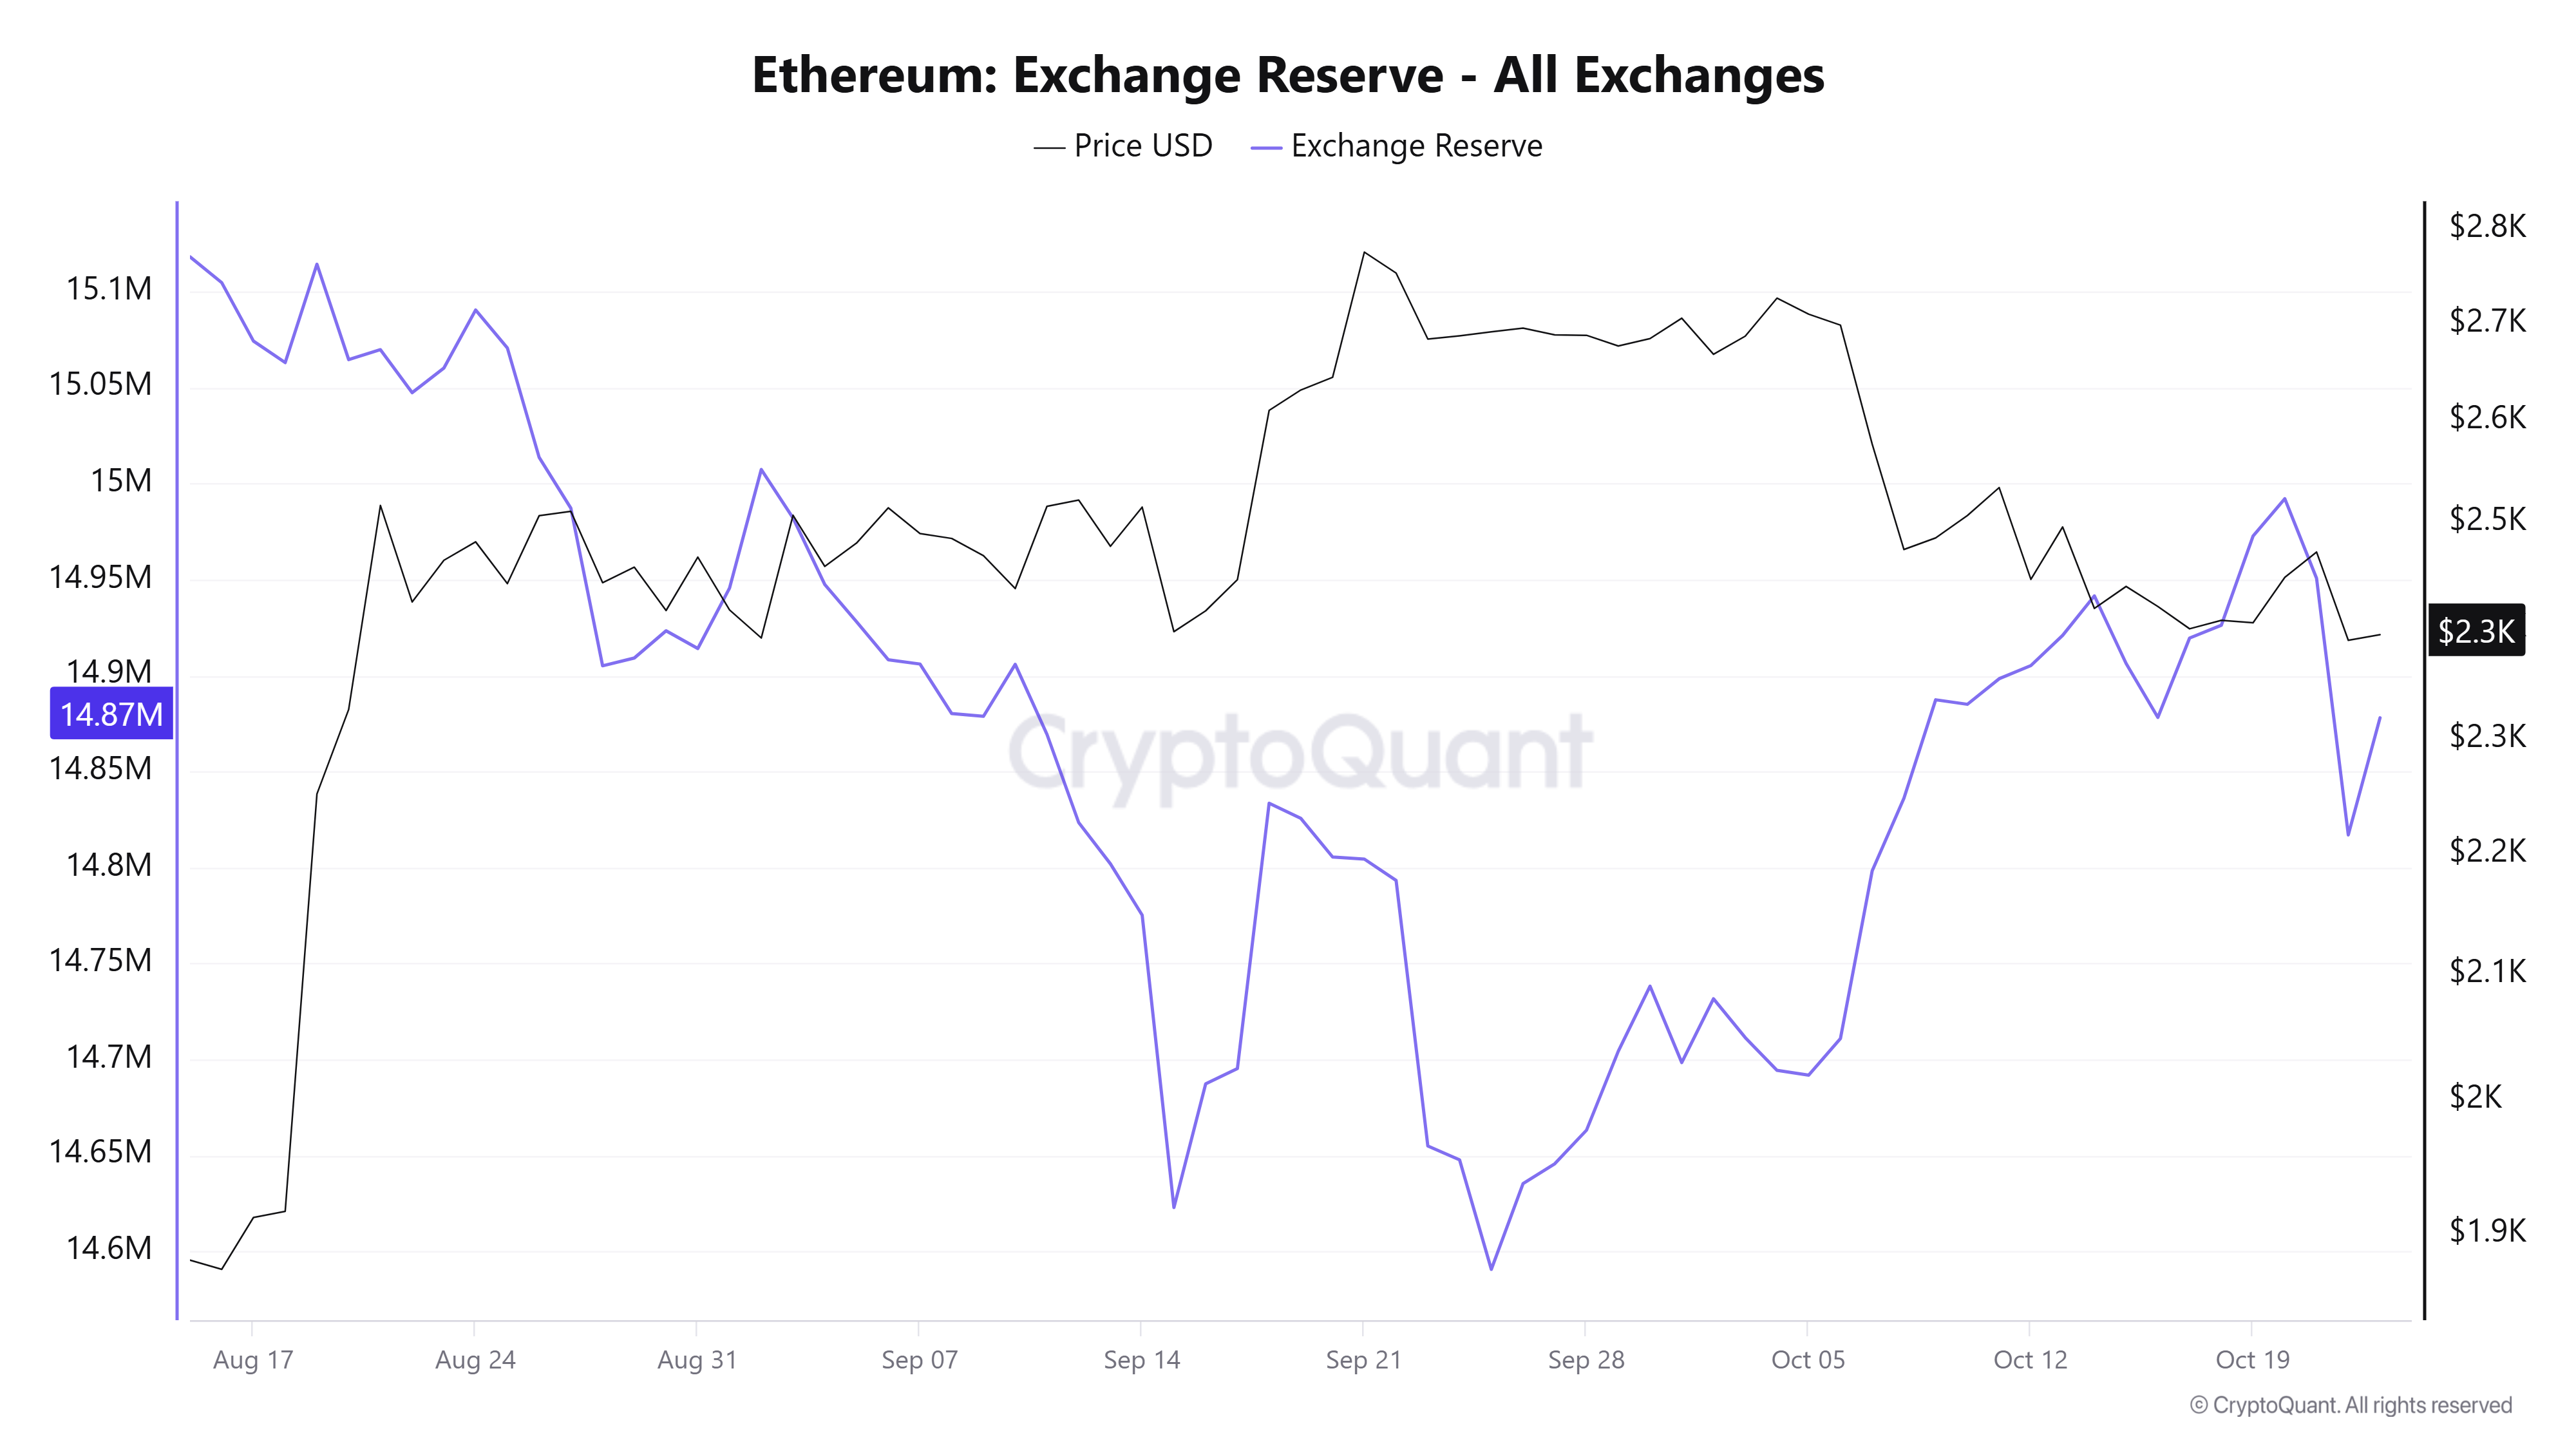
Given the significance of US markets, selling pressure may be weighing on overall ETH spot markets. Ethereum Exchange Reserves, which measures the total amount of ETH held across exchange wallets, ticked upward again on Friday after a slight decline on October 22.
Exchange Reserves had increased by 402K ETH between September 25 and October 20. It dropped by 170K ETH over the past two days but is trending upward again.
The Realized Price, or average on-chain cost basis, at $2,311 remains a key support level to watch as selling pressure dominates.
Ethereum technical outlook: ETH tests 100-day EMA
Ethereum saw $60.5 million in liquidations over the past 24 hours, led by $50.1 million in liquidated long positions, according to Coinglass.
On the daily chart, ETH is keeping a corrective bearish bias as it sits beneath the 20-day and 50-day Exponential Moving Averages (EMAs) clustered near $2,470. The altcoin, however, holds marginally above the 100-day EMA around $2,357 and nearby horizontal support at $2,355, suggesting that sellers are testing but have not yet broken the broader medium-term base. The 14-day Relative Strength Index (RSI) near 38 and a Stochastic reading close to oversold territory hint at lingering downside pressure but also the potential for short-covering if support holds.
On the topside, immediate resistance is located at the 20-day and 50-day EMAs, followed by a former horizontal cap at $2,548 and a higher barrier near $2,637. Above these, stronger resistance is seen at $2,782, ahead of $3,075 and $3,253.
On the downside, initial support is defined by the 100-day EMA at $2,357 and the adjacent horizontal level at $2,355. A daily close below this zone would expose the next cushions at $2,205, then $1,972 and $1,828, where buyers would be expected to regroup more decisively.
(The technical analysis of this story was written with the help of an AI tool. Know more.)