
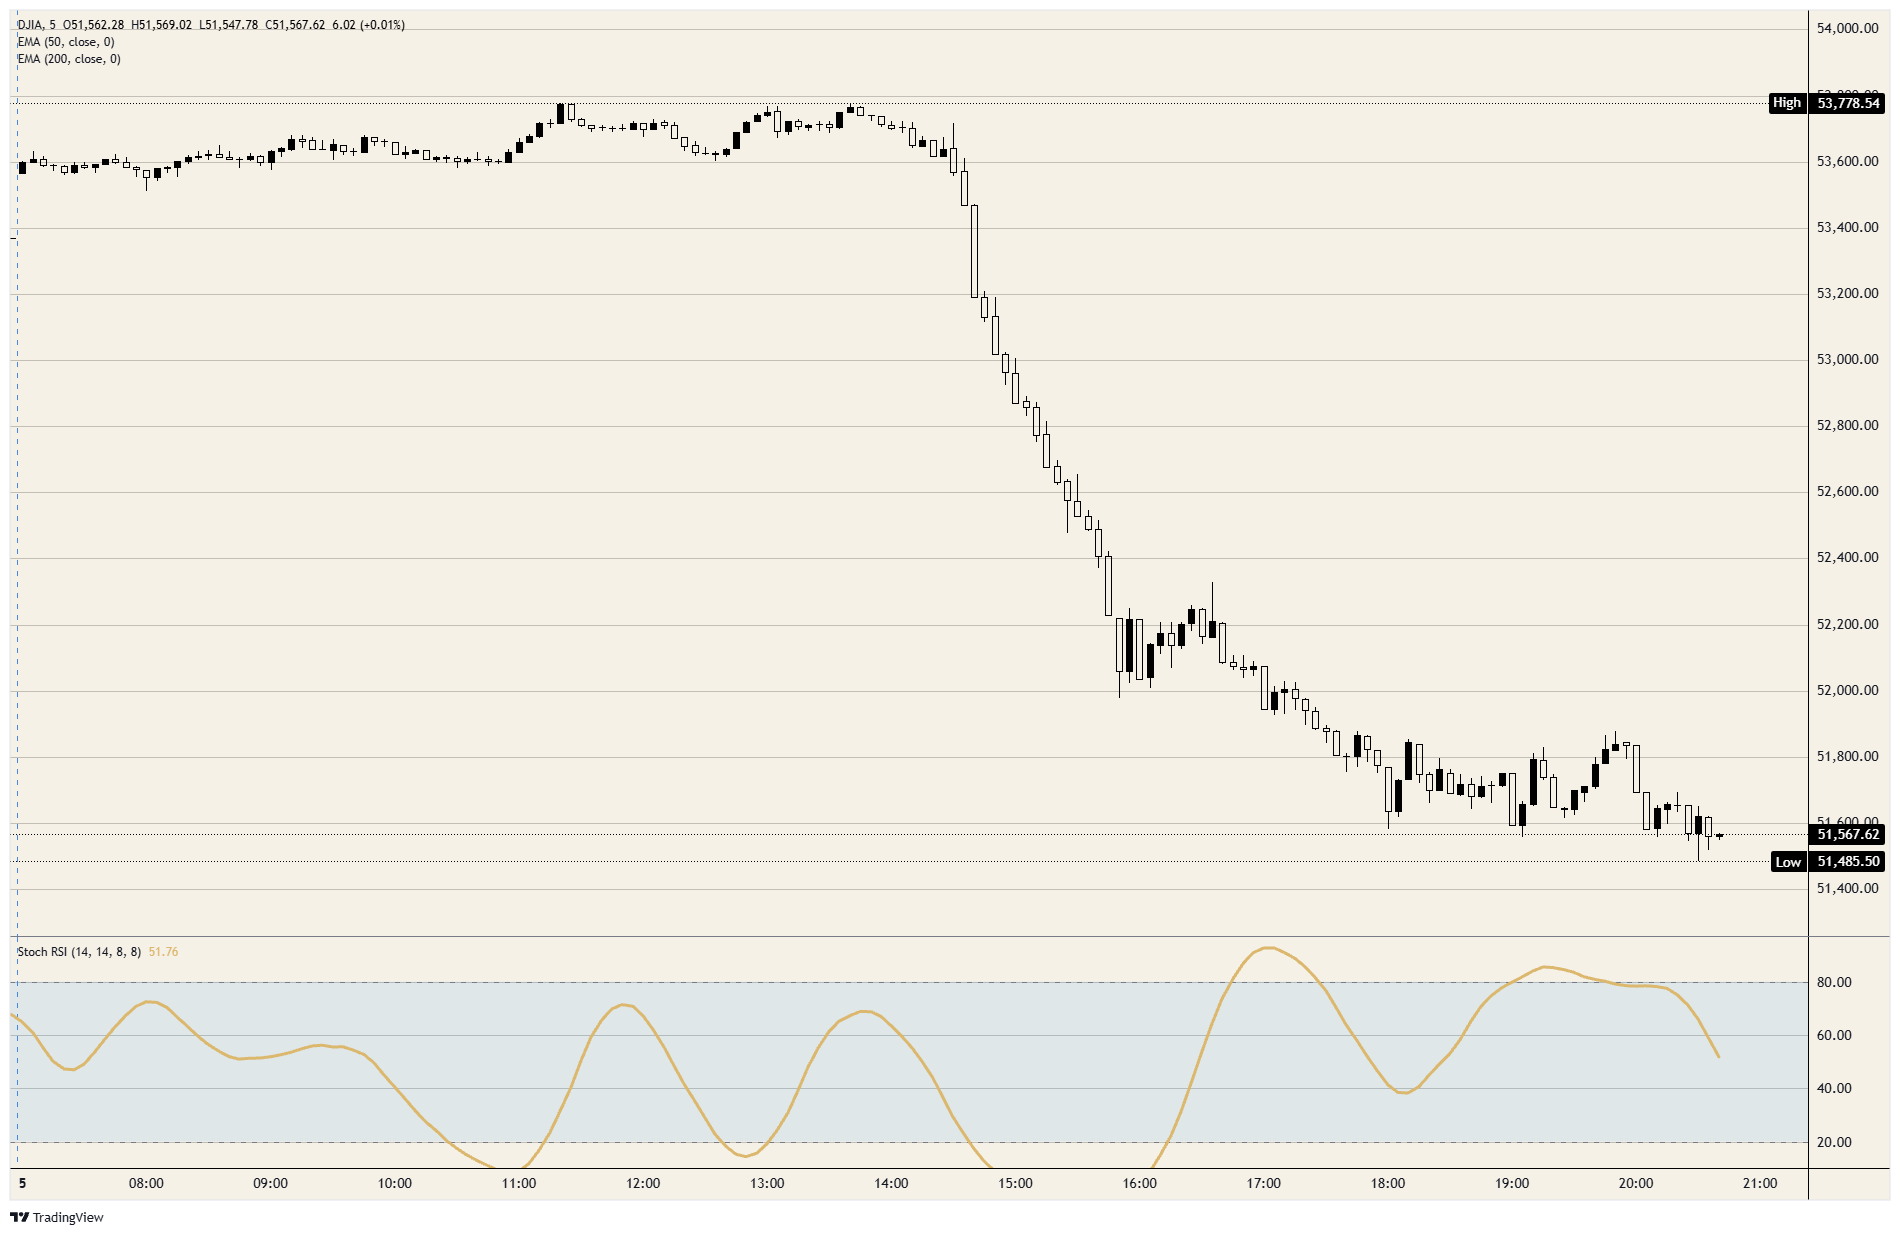
Wednesday was the Dow Jones Industrial Average’s best session since April 2025 and Thursday is on track to be its worst since the same month, on the same election result. The index trades just above 51,500, below Tuesday’s close and at its lowest since October 14. Twenty-nine of its thirty members are lower, and the thirtieth is Coca-Cola (KO).
The selling started in the chipmakers and did not stay there. The Nasdaq Composite is more than 10% below its October record, and chip stocks as a group are on track for their worst session since March 2020. The Cboe Volatility Index (VIX) touched 28, its highest since March 31. Investors are treating Tuesday’s result as a vote on the data-centre buildout, and the Dow holds less of that trade than the other two indices.
Goldman Sachs did three times the damage Nvidia did
The Dow is price-weighted, so a member’s pull on the index is its share price, not its size. Goldman Sachs (GS) at about $870 a share is a tenth of the index, and its drop of about 6% accounts for roughly a fifth of the points lost. Nvidia (NVDA) at about $180 is 2% of the index, and its 9% drop accounts for about 6%. A $4 trillion company fell by more than the bank and moved the Dow about a third as far.
Caterpillar (CAT) is the second-largest drag. Its power generation sales rose 30% to $3.42 billion in the third quarter reported October 29, mostly turbines and large engines for data centres. That makes it the member most directly tied to the buildout the election has put in question. Five of the biggest US technology companies are in the index, Apple, Amazon, Alphabet, Microsoft and Nvidia, and together they account for less than a fifth of the fall. The other four fifths is banks, industrials, healthcare and the rest of the list.
The banks have a second problem. The Senate Banking Committee is expected to pass to Senator Elizabeth Warren in January, and she has already asked regulators to withdraw three bank capital proposals. JPMorgan (JPM) is down about 4%. Under price weighting it and Goldman are about 14% of the Dow against about 2% of the S&P 500, so the committee’s view of bank capital weighs on this index far more than on the broad one.
The backlash was filed in March
The moratorium bill was introduced on March 25. Senator Bernie Sanders and Representative Alexandria Ocasio-Cortez filed the AI Data Center Moratorium Act to halt new construction until Congress passes artificial intelligence (AI) regulation, and Sanders repeated the call on Wednesday after the results. Lawmakers in at least 11 states had proposed pauses of their own by then.
Tuesday’s ballots carried more than 40 local data-centre measures, and voters backed restrictions in nearly all of them. Democrats won the Senate seat and the governor’s office in both Texas and Ohio, where the buildout is concentrated, after campaigns in which data centres were an issue. Fitch said a major share of planned capacity may face regulatory hurdles in Texas, Georgia and Ohio. UBS estimates that construction pauses could put about 30% of the capacity planned for 2028 at risk. Alphabet (GOOGL) announced a $17 billion data centre in Wyoming during the session, and its shares fell with everyone else’s.
Friday’s payrolls arrive with December already priced
Thursday’s data was good for the economy and nobody traded it. Initial jobless claims fell to 189K in the week to October 31 against a 196K forecast, matching the lowest reading since 1969. Third-quarter productivity grew 3.6% against 2.5% expected, and unit labour costs fell 0.7%, the first drop since the second quarter of 2025. The 10-year Treasury yield still fell, to about 4.85%.
Cleveland Fed President Beth Hammack said she sees inflation pressure spilling across the economy and the labour market potentially strengthening. Richmond Fed President Tom Barkin said inflation is the Fed’s most important risk and that the AI buildout has added to demand. He also said data centres employ too few people to have natural constituencies in the communities that host them. The Fed held at 3.75%-4.00% on October 28, and futures priced an increase at the December 9 meeting at close to 80% going into the session.
October payrolls are due Friday at 13:30 GMT, forecast at 65K after 29K in September, with unemployment forecast to hold at 4.2% and average hourly earnings at 0.3% MoM. A number near the forecast keeps the December increase and adds a higher borrowing cost to Thursday’s slower-buildout story. A miss lowers the odds of the increase and replaces it with a slower economy, which is a different reason to sell the same index. Friday’s report is the first of two the Fed sees before December 9, and the futures market has priced the meeting before either arrives.
The 200-day average comes into reach
Resistance: The 50-day Exponential Moving Average (EMA) near 52,150 is the first level. Wednesday’s close above it was the first since October 29 and lasted one session. Above that are the late-October high near 52,900 and Thursday’s pre-open high just below 53,800, where the rally on the results ended.
Support: Thursday’s low just below 51,500 is the lowest since October 14, and the October 14 low near 51,400 is the next level under it. Below that, the early-October lows near 51,000 are the base the climb from October 1 was built on.
Bias: Lean short while the 50-day EMA near 52,150 caps on a closing basis. The first objective is the early-October lows near 51,000, and the second is the 200-day EMA near 50,800, which the index has not traded since April 7. The daily Stochastic Relative Strength Index (Stoch RSI) is near 57, halfway down from its late-October top and still falling. A daily close back above 52,150 makes Thursday a one-day event, as Wednesday was, and ends the short.
Dow Jones Industrial Average 5-minute chart
Dow Jones FAQs
The Dow Jones Industrial Average, one of the oldest stock market indices in the world, is compiled of the 30 most traded stocks in the US. The index is price-weighted rather than weighted by capitalization. It is calculated by summing the prices of the constituent stocks and dividing them by a factor, currently 0.152. The index was founded by Charles Dow, who also founded the Wall Street Journal. In later years it has been criticized for not being broadly representative enough because it only tracks 30 conglomerates, unlike broader indices such as the S&P 500.
Many different factors drive the Dow Jones Industrial Average (DJIA). The aggregate performance of the component companies revealed in quarterly company earnings reports is the main one. US and global macroeconomic data also contributes as it impacts on investor sentiment. The level of interest rates, set by the Federal Reserve (Fed), also influences the DJIA as it affects the cost of credit, on which many corporations are heavily reliant. Therefore, inflation can be a major driver as well as other metrics which impact the Fed decisions.
Dow Theory is a method for identifying the primary trend of the stock market developed by Charles Dow. A key step is to compare the direction of the Dow Jones Industrial Average (DJIA) and the Dow Jones Transportation Average (DJTA) and only follow trends where both are moving in the same direction. Volume is a confirmatory criteria. The theory uses elements of peak and trough analysis. Dow’s theory posits three trend phases: accumulation, when smart money starts buying or selling; public participation, when the wider public joins in; and distribution, when the smart money exits.
There are a number of ways to trade the DJIA. One is to use ETFs which allow investors to trade the DJIA as a single security, rather than having to buy shares in all 30 constituent companies. A leading example is the SPDR Dow Jones Industrial Average ETF (DIA). DJIA futures contracts enable traders to speculate on the future value of the index and Options provide the right, but not the obligation, to buy or sell the index at a predetermined price in the future. Mutual funds enable investors to buy a share of a diversified portfolio of DJIA stocks thus providing exposure to the overall index.