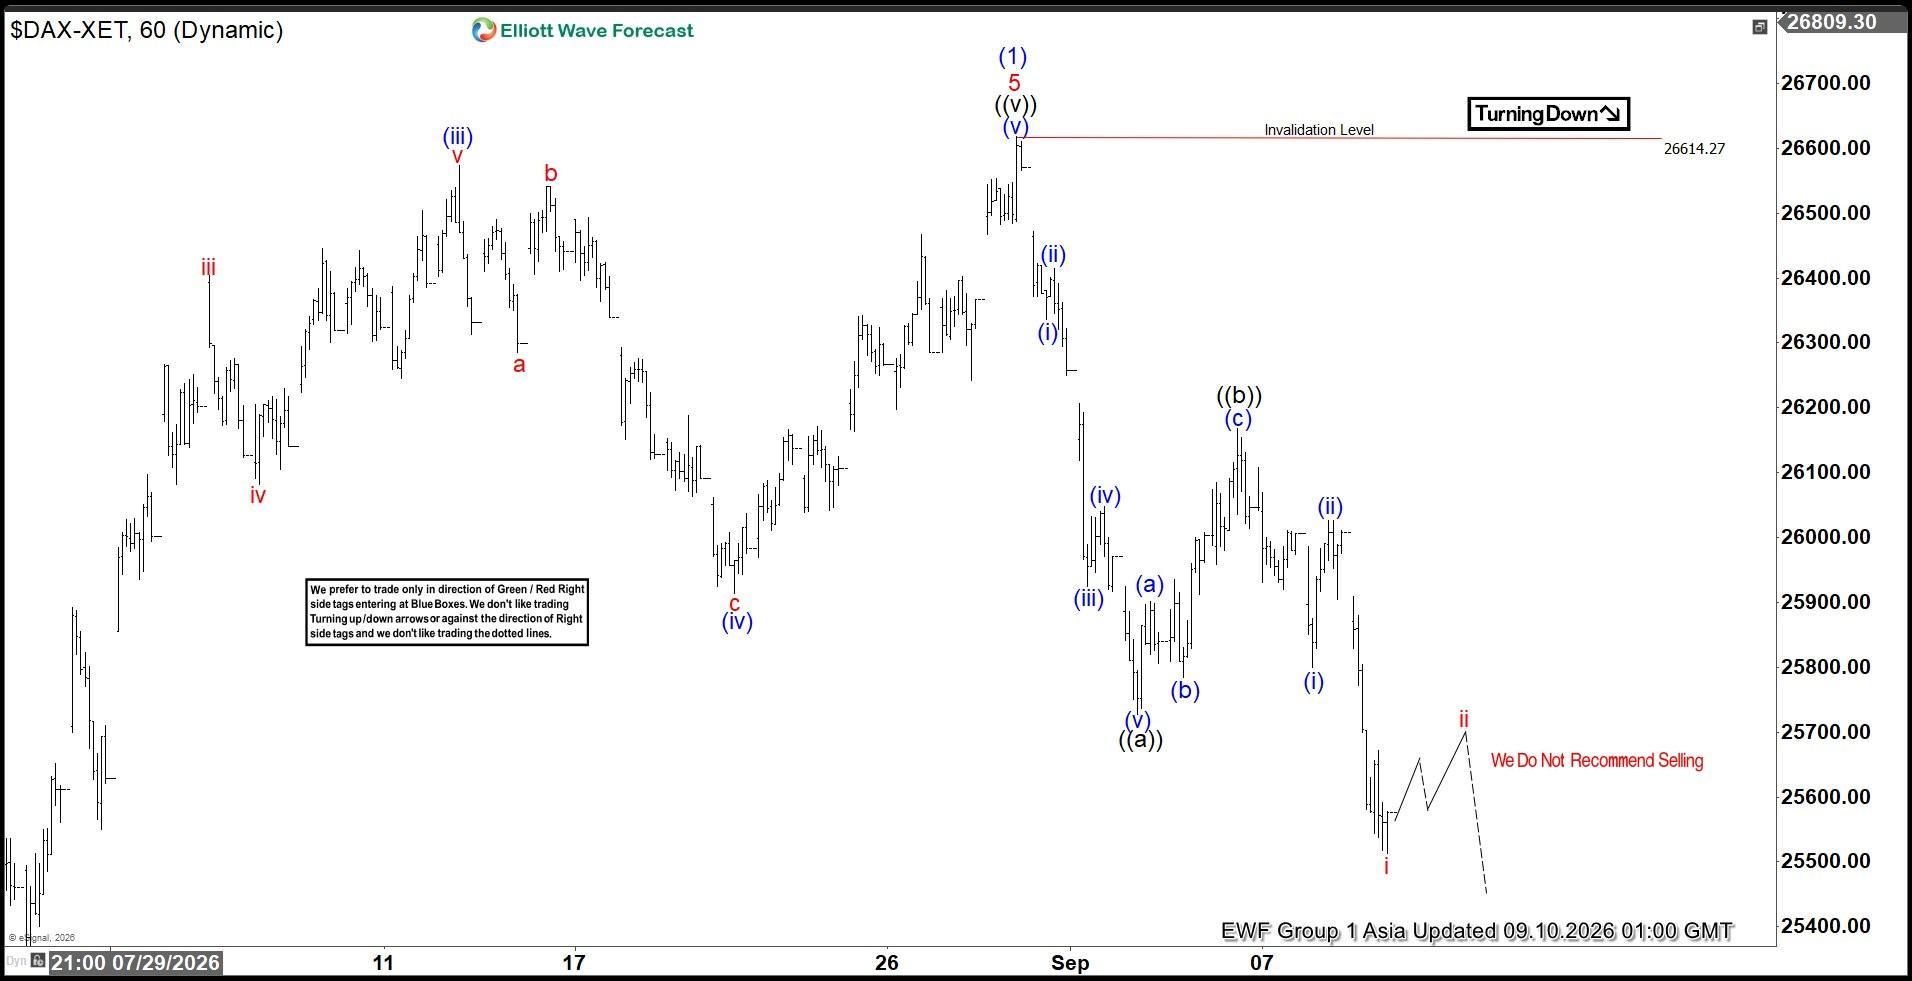
The short‑term Elliott Wave view in DAX shows the cycle from the March 23, 2026 low has ended in wave (1) at 26,614.27. This advance formed a clear impulse structure. With wave (1) complete, the Index has entered a larger degree correction in wave (2). The internal subdivision of this correction is unfolding as a double three WXY pattern. Wave W is progressing as a zigzag.
From the peak of wave (1), wave ((a)) declined to 25,727.93. A counter‑trend rally in wave ((b)) followed and ended at 26,167.93. The Index has since resumed lower in wave ((c)). This leg targets the 100%–161.8% Fibonacci extension of wave ((a)). The projected area lies between 24,737 and 25,283. Within this zone, wave W of the double three may complete.
Once wave W finishes, a rally in wave X should develop. This rally will correct the cycle from the August 28, 2026 high before the broader decline resumes. The corrective structure highlights the maturity of the cycle and sets expectations for further weakness after wave X.
DAX 60-minute Elliott Wave chart
DAX Elliott Wave [Video]