Overview
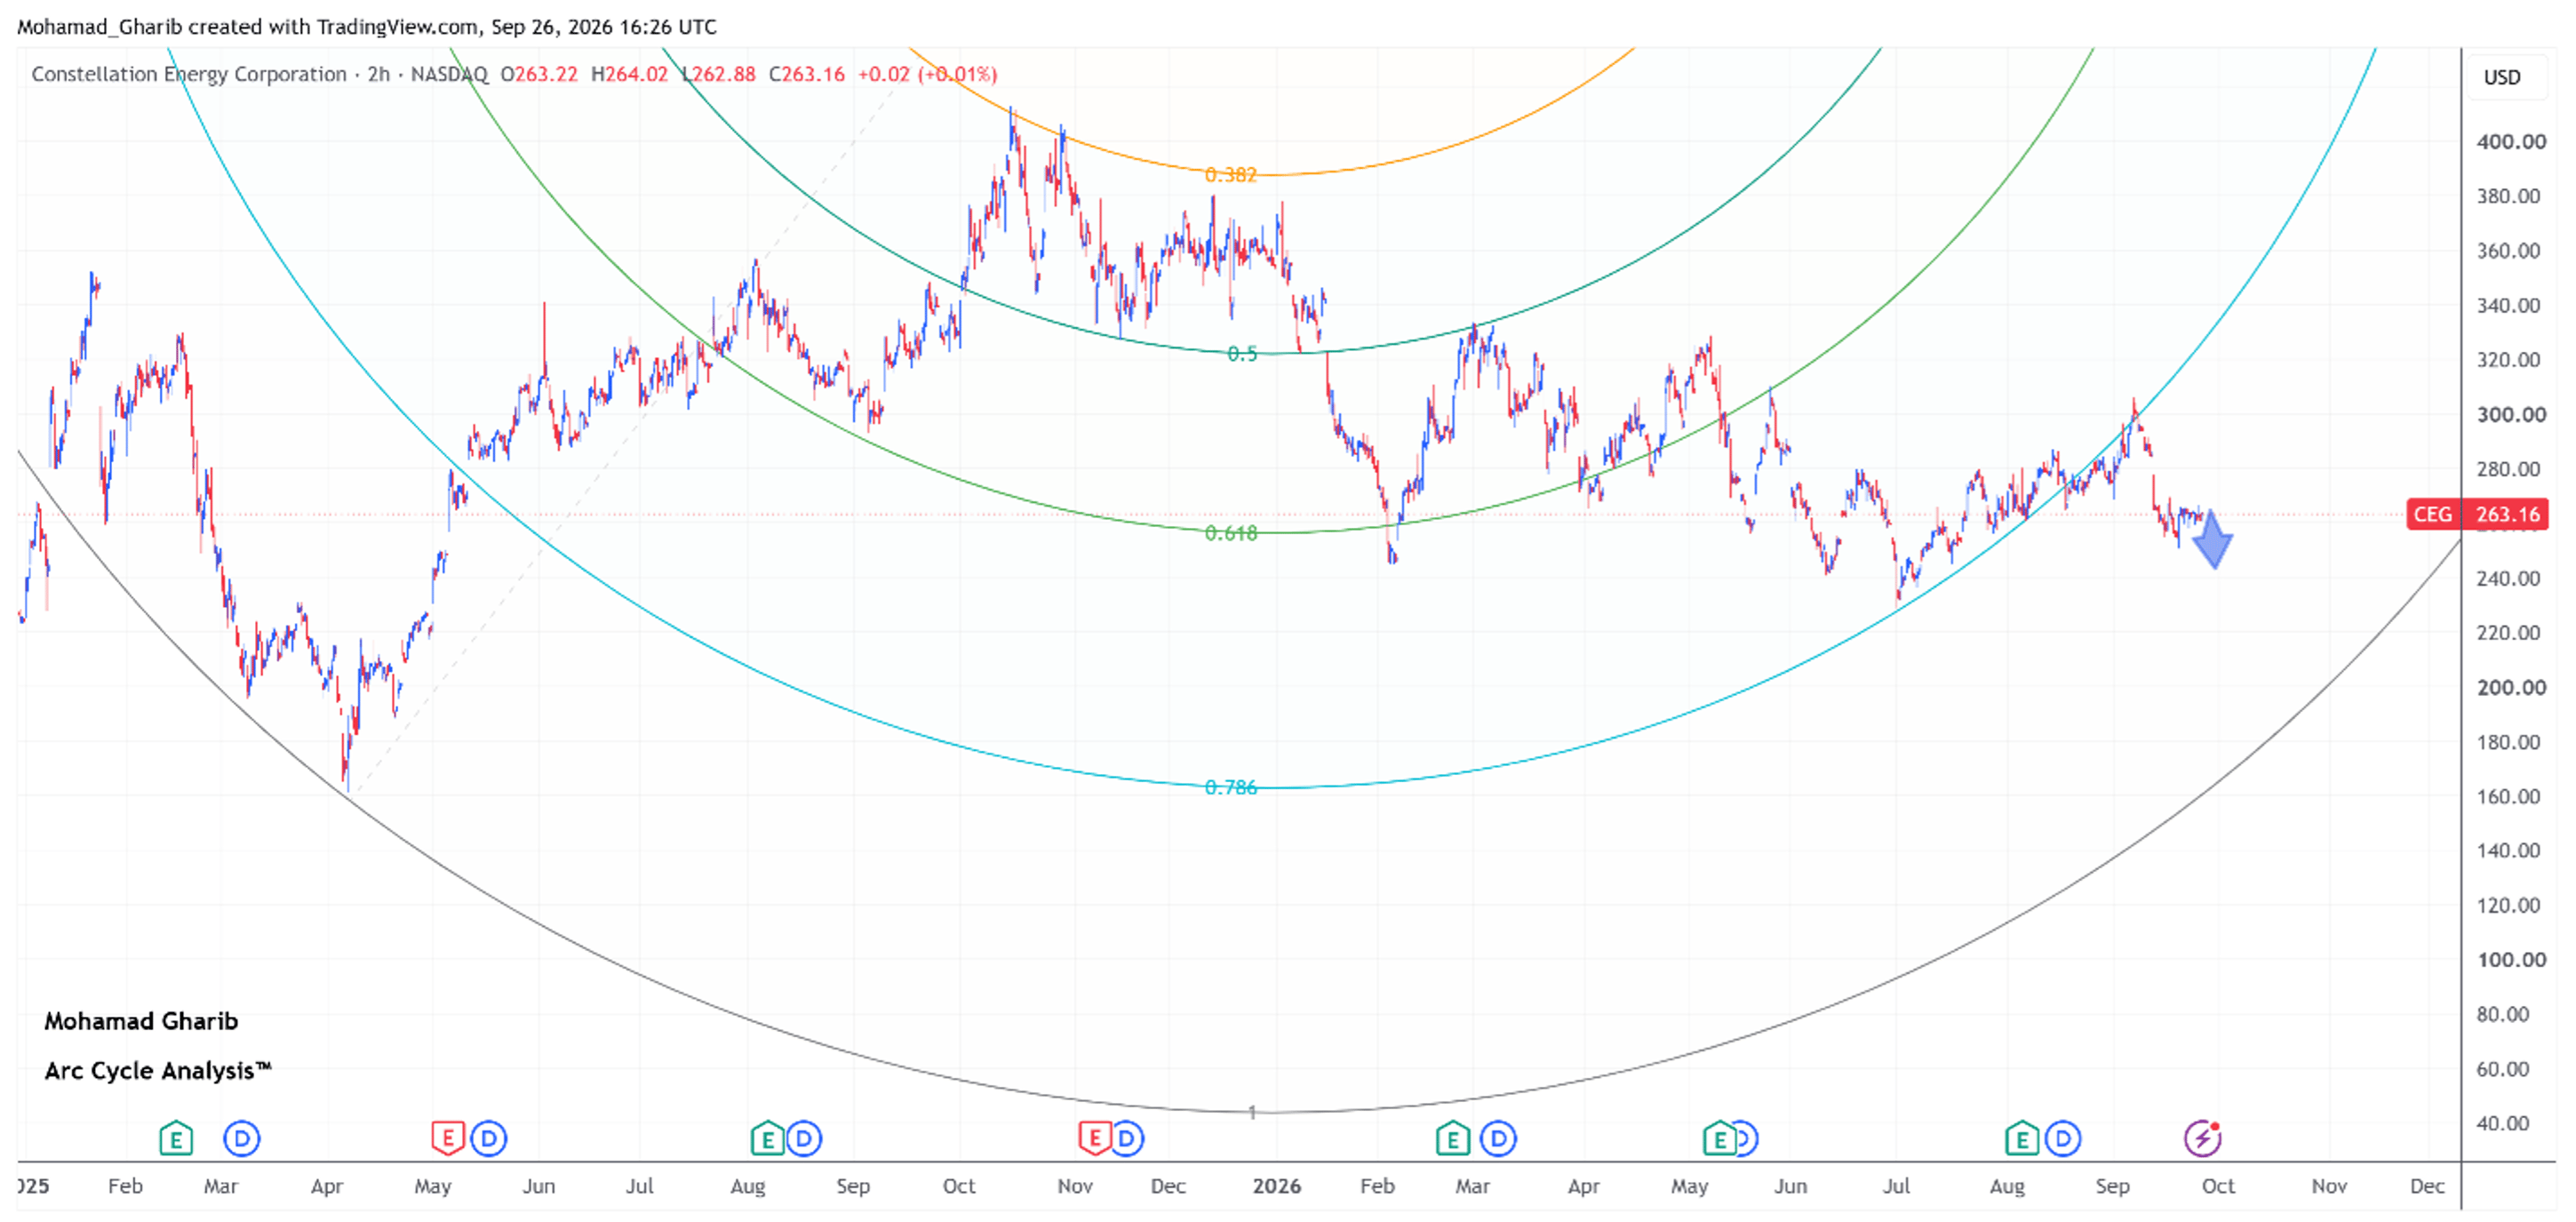
Based on Arc Cycle Analysis applied to the 2h chart, Constellation Energy Corporation has broken below the 0.786 Support Arc within the current Arc Cycle. The breakdown confirms a bearish shift in price structure and opens the potential for continued movement toward the next Support Arc.
|
Metric |
Reading |
|
Market Bias |
Bearish Acceleration |
|
Preferred Scenario |
Breakdown |
|
Primary Target Zone |
245.00 |
|
Scenario Invalidation |
Sustained close back above 270.00 |
|
Current Arc Level |
Below Support Arc (0.786) |
|
Cycle Status |
Declining Toward Next Arc |
|
Arc Integrity |
Weakening |
Market outlook
Price has broken below the 0.786 Support Arc, confirming a bearish breakdown within the current Arc Cycle. A sustained breakdown below the Support Arc supports continued movement toward 245.00 price.
Conversely, a sustained 2h close back above the broken Support Arc would weaken the breakdown scenario and could shift the outlook back toward the previous 0.618 Resistance Arc.