
WTI crude oil is pressing into a major technical wall just as the next big fundamental catalyst approaches!
Will the Hormuz-driven rally have enough momentum to break through descending channel resistance?
Or is a rejection back toward $80 the more likely outcome?
WTI Crude Oil (USOIL) 4-hour Chart Faster with TradingView
The Strait of Hormuz standoff shows no signs of being resolved after Iran’s security council secretary ruled out linking any Oman shipping arrangement to a full reopening. Meanwhile, a U.S. Navy helicopter incident involving a cargo ship registered in Panama added fresh risk premium to crude.
Wednesday’s U.S. CPI report is the next major driver, with the inflation reading likely setting the near-term tone for oil and broader risk assets.
Remember that directional biases and volatility conditions in market price are typically driven by fundamentals. If you haven’t yet done your homework on WTI crude oil and the U.S. dollar, then it’s time to check out the economic calendar and stay updated on daily fundamental news!
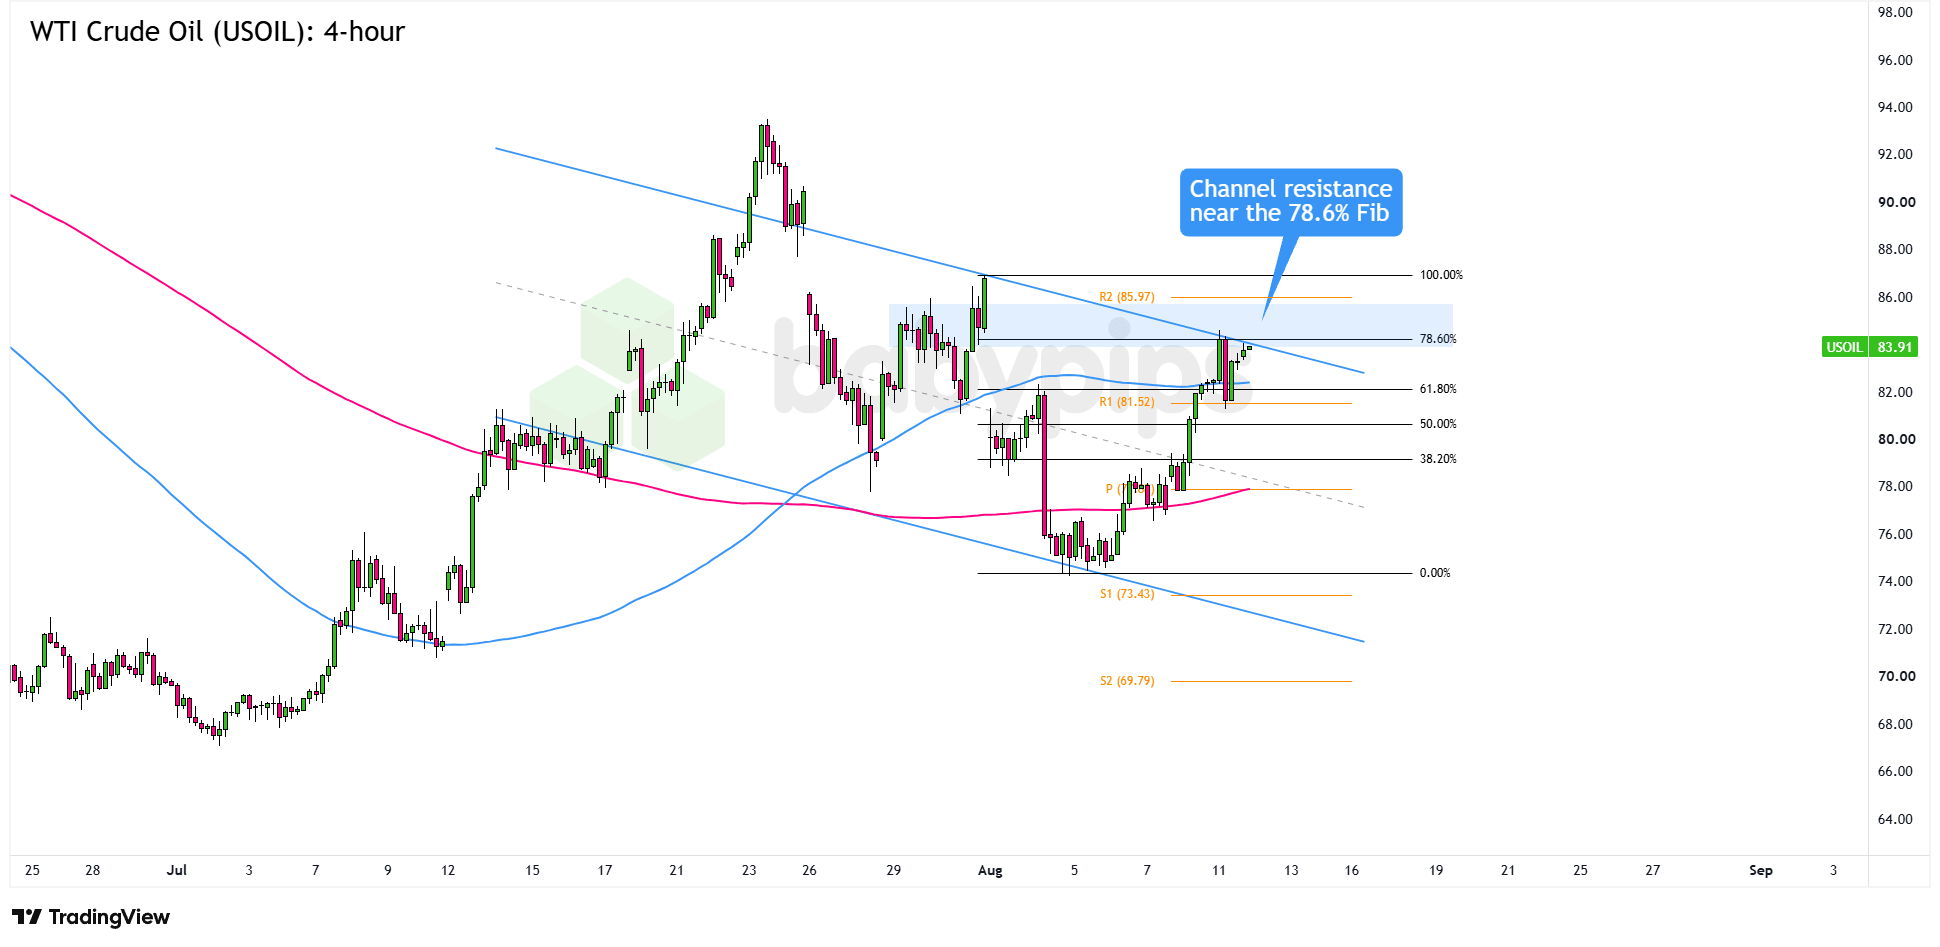
WTI crude oil staged a sharp recovery from its early August lows near $74, climbing back through the major Fibonacci retracement levels before stalling right at the 78.6% Fib, which lines up with the upper boundary of a descending channel.
Price has been chopping around this confluence zone instead of pushing cleanly higher, a sign that sellers are defending the area.
The R2 Pivot Point line at 85.97 and the 88.00 psychological level sit above as the next logical targets if the breakout is confirmed. Watch for a convincing close above channel resistance, which could open the door toward R2 at 85.97 and the 88.00 area, particularly if CPI comes in softer than expected.
On the flip side, if USOIL rolls over from the 78.6% Fib and channel resistance holds, bears could push price back toward the 80.00 psychological handle, with deeper losses possible if inflation comes in hotter than expected.
Whichever bias you end up trading, don’t forget to practice proper risk management and stay aware of top-tier catalysts that could influence overall market sentiment!
WTI crude oil is pressing into a zone where a Fibonacci retracement level and descending channel resistance overlap, and if you’re not sure how to read stacked technical factors at the same level, Premium members can read our lesson:
📖 Confluence: Stacking the Odds in Your Favor
Reading this helps you understand how confluence zones work, why multiple factors at the same price level change the probability of a setup, and how to assess a breakout versus rejection scenario before it plays out.
And if you’re not a Premium subscriber yet, now’s a good time to sign up.
With Babypips Premium, you get full access to School of Pipsology lessons that help you understand not just where price is stalling, but why overlapping technical signals at the same level shift the odds of a breakout or rejection.

