
WTI crude oil recently busted through a short-term double bottom neckline, suggesting that an uptrend is in order.
However, the rally could stall at these nearby inflection points. Take a look at this long-term area of interest seen on the daily time frame:

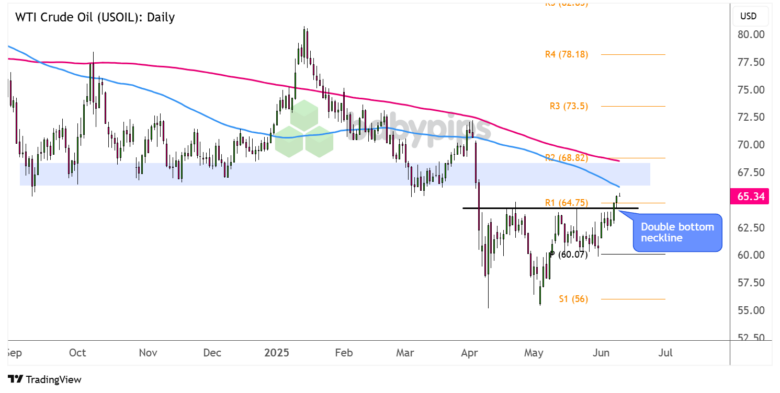
WTI Crude Oil (USOIL) Daily Chart by TradingView
An improved global trade outlook, combined with a lower than expected OPEC+ oil output level for May, enabled the energy commodity to bust through the double bottom neckline resistance around R1 ($64.75).
This could mean that a rally of the same height as the chart formation is in the works, but there are still significant roadblocks for bulls nearby.
Will the support-turned-resistance at $67.50 per barrel keep gains in check?
Remember that directional biases and volatility conditions in market price are typically driven by fundamentals. If you haven’t yet done your homework on the British pound and the U.S. dollar, then it’s time to check out the economic calendar and stay updated on daily fundamental news!
The 100 SMA is still below the 200 SMA on the daily time frame, suggesting that the path of least resistance is to the downside. At the same time, these moving averages are right in line with the area of interest at the $67.50 per barrel minor psychological mark.
If resistance holds, look out for a continuation of the crude oil selloff back to nearby support zones at the pivot point level ($60.07) or onto the lows at S1 ($56.00).
On the other hand, long green candlesticks sustaining the climb past R2 ($68.82) could clear the path for a move up to the next bullish targets at R3 ($73.50) then R4 ($78.18) close to this year’s highs at $80 per barrel.
Whichever bias you end up trading, don’t forget to practice proper risk management and stay aware of top-tier catalysts that could influence overall market sentiment!
Disclaimer:
Please be aware that the technical analysis content provided herein is for informational and educational purposes only. It should not be construed as trading advice or a suggestion of any specific directional bias. Technical analysis is just one aspect of a comprehensive trading strategy. The technical setups discussed are intended to highlight potential areas of interest that other traders may be observing. Ultimately, all trading decisions, risk management strategies, and their resulting outcomes are the sole responsibility of each individual trader. Please trade responsibly.

