
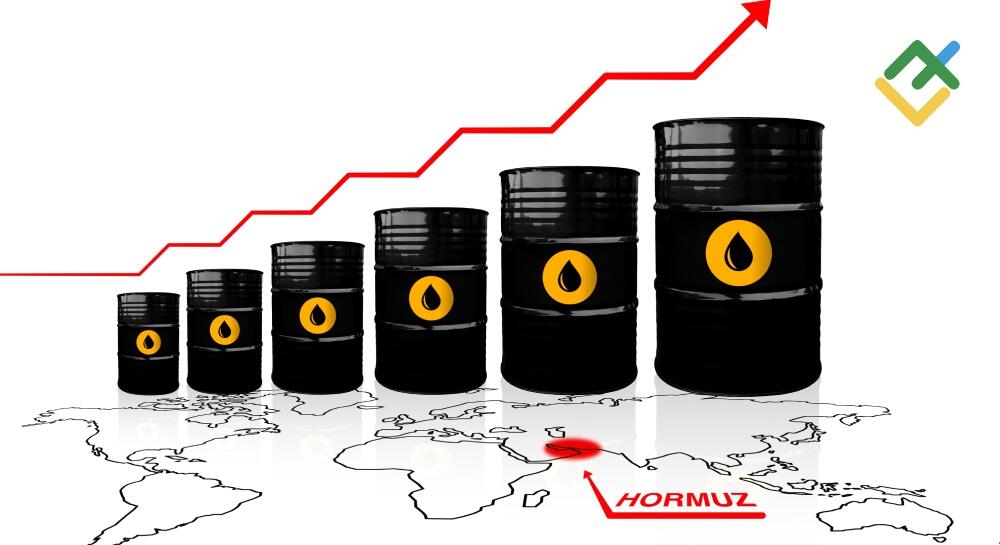

The factors holding back the Brent rally—including supply diversions, declining Chinese imports, rising US production, and other headwinds—no longer exert the same pressure they once did. As these constraints weaken, oil prices are coming under renewed upward momentum. Let’s examine the situation and develop a trading plan.
The article covers the following subjects:
Major Takeaways
- China is increasing its oil imports.
- Saudi Arabia’s alternative supply routes are coming under threat.
- US strategic reserves are at their lowest levels since 1982.
- Long positions on Brent can be opened with targets at $103 and $108.
Weekly Fundamental Forecast for Oil
Brent has climbed back above $100. However, that does not necessarily mean prices will retreat from these levels as quickly as they did in May or July. The buffers restraining the rally are weakening, giving bulls fresh motivation to launch another attack. Perhaps the long-awaited apocalypse was always bound to arrive sooner or later. Why not now?
For a long time, substantial global reserves, declining Chinese imports, rising production from non-OPEC+ countries, workarounds to supply disruptions, and persistent rumors of US-Iran negotiations helped keep Brent prices in check. The Persian Gulf has gradually adapted to the armed conflict, while export flows have increased enough to keep the global oil market in relative balance. Yet that balance always looked fragile—and investors’ instincts proved to be right.
Oil Exports by Middle Eastern Countries
Source: Reuters.
As US economic pressure on Iran increases, Tehran appears to be responding more assertively. Iran has moved from targeting US military bases to intercepting and raiding enemy vessels—an escalation that threatens to further disrupt transit through the Strait of Hormuz. According to Kpler, the number of tankers transiting the strait fell from 9 to 6 on September 8, well below the average of 12 recorded over the preceding 10 days.
Oil Shipments Through Strait of Hormuz
Source: Reuters.
Saudi Arabia’s alternative export routes have helped mitigate the disruption. However, continued attacks by Yemen’s Houthis on regional infrastructure, along with the risk of further disruption around the Bab el-Mandeb Strait, could put additional pressure on oil flows from the Middle East. The International Energy Agency (IEA) forecasts a 4.3 million bpd supply reduction in 2026, about 4% of global supply. If disruptions persist or intensify, the impact could be even greater.
Goldman Sachs forecasts Brent could reach $120 if the conflict extends into 2027, while Bank of America expects Brent to remain in the $95–125 range through the end of this year. Against this backdrop, investors are increasingly focusing on China, which has previously helped support the oil market by significantly increasing imports. In August, shipments to China rose by 6.2%.
China’s Oil Imports
Source: Bloomberg.
If we also factor in a significant decline in global inventories—including US strategic reserves, which have fallen to their lowest level since 1982—alongside rising petroleum product prices amid the conflict in Ukraine and the absence of negotiations between Washington and Tehran, the oil market outlook becomes increasingly gloomy. The severe supply disruption scenario discussed in early March could materialize as early as 2026. This risk is particularly relevant now that Brent bears have lost one of their key advantages: expectations, reinforced by Donald Trump’s statements, that the conflict would end in the near term.
Weekly Trading Plan for Brent
Given the current bullish market conditions, maintaining long positions in Brent, which opened above $91 per barrel, appears justified. The first target of $103 is within reach. Any pullbacks could provide opportunities to add to long positions, with $108 remaining the second target.
This forecast is based on the analysis of fundamental factors, including official statements from financial institutions and regulators, various geopolitical and economic developments, and statistical data. Historical market data are also considered.
Price chart of UKBRENT in real time mode
The content of this article reflects the author’s opinion and does not necessarily reflect the official position of LiteFinance broker. The material published on this page is provided for informational purposes only and should not be considered as the provision of investment advice for the purposes of Directive 2014/65/EU.
According to copyright law, this article is considered intellectual property, which includes a prohibition on copying and distributing it without consent.

