
Bitcoin (BTC), Ethereum (ETH) and Ripple (XRP) bears remain in control, with the top three cryptocurrencies correcting over 4%, 6% and 10%, respectively, last week and marking their fifth consecutive weeks of losses. BTC trades around $75,530 on Monday after closing below key Exponential Moving Averages (EMAs), leaving the $70,000 level as its next major support. Meanwhile, ETH hovers near $2,155, while XRP trades around $1.11, with both altcoins facing downside risks toward $2,000 and $1, respectively.
Bitcoin closes below major supports
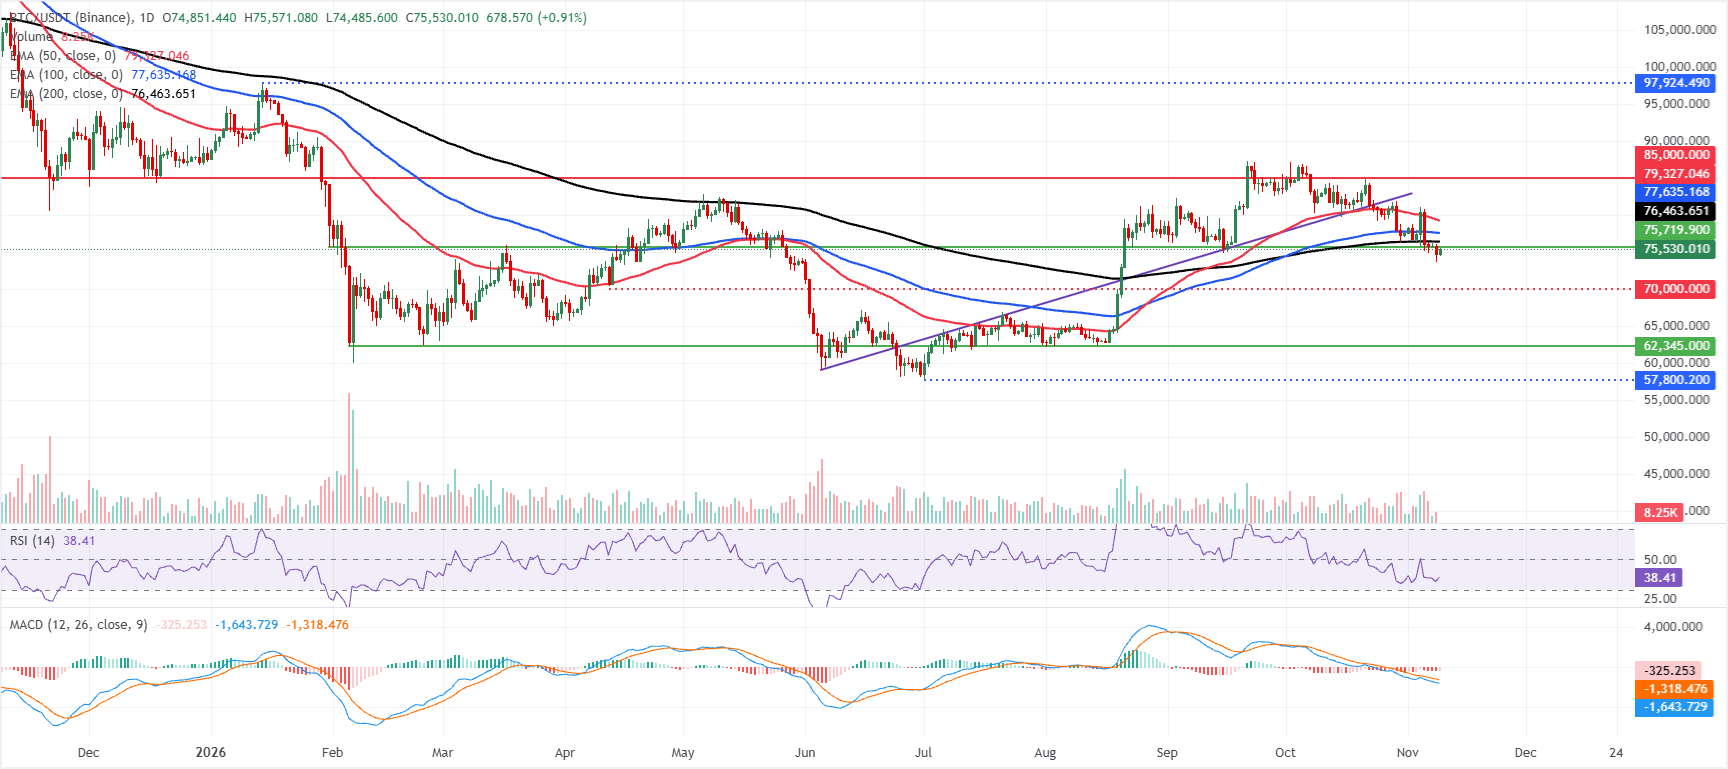
Bitcoin price trades at $75,530 on Monday, maintaining a bearish near-term tone as it holds below key Exponential Moving Averages (EMAs). The 200-day EMA at $76,463 acts as the first overhead cap, followed higher by the 100-day EMA at $77,635 and the 50-day EMA near $79,327, all reinforcing a structure of persistent topside supply.
Momentum conditions remain soft, with the Relative Strength Index (RSI) hovering in the high-30s and the Moving Average Convergence Divergence (MACD) stuck in negative territory, hinting that selling pressure still outweighs dip-buying interest.
On the topside, immediate resistance is located at the 200-day EMA around $76,463, ahead of a secondary barrier at the 100-day EMA near $77,635 and a deeper recovery hurdle at the 50-day EMA close to $79,327. Further up, a horizontal resistance line at $85,000 marks a stronger bullish validation level where buyers would need to reclaim ground to challenge the broader bearish bias.
On the downside, the absence of nearby mapped support suggests that any break lower from current levels would send BTC toward the psychological support zone around $70,000 before stabilizing.
Ethereum bears eye $2,000 mark
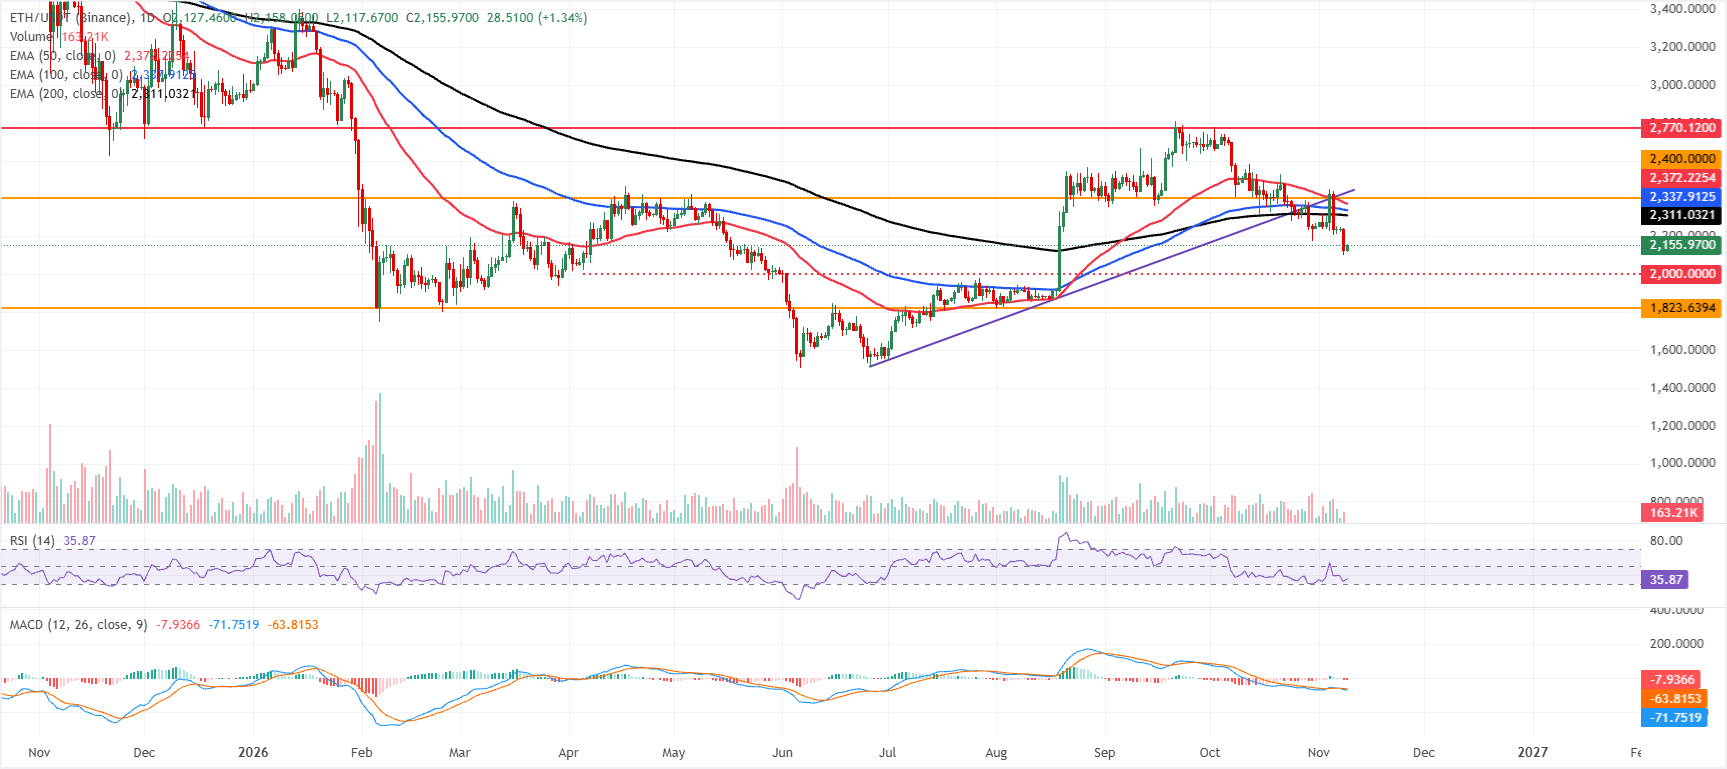
Ethereum price trades at $2,155 on Monday, maintaining a bearish near-term bias as it remains well below the 200-day EMA at $2,311, the 100-day EMA at $2,337, and the 50-day EMA at $2,372. The loss of the previously upward-sloping support trendline, now broken around $2,432, reinforces a corrective tone, while the RSI hovering near 35 and the MACD in negative territory suggest lingering downside momentum rather than outright capitulation.
On the topside, initial resistance is seen at the 200-day EMA near $2,311, followed by the 100-day EMA at $2,337 and the 50-day EMA at $2,372, with a more notable horizontal barrier at $2,400 and the former rising trendline break zone around $2,432 capping any stronger rebound.
On the downside, the next meaningful support sits around the key $2,000 level ahead of the prior horizontal base around $1,823, where buyers would be expected to show more robust interest if the current decline extends.
XRP bears aiming for next key support
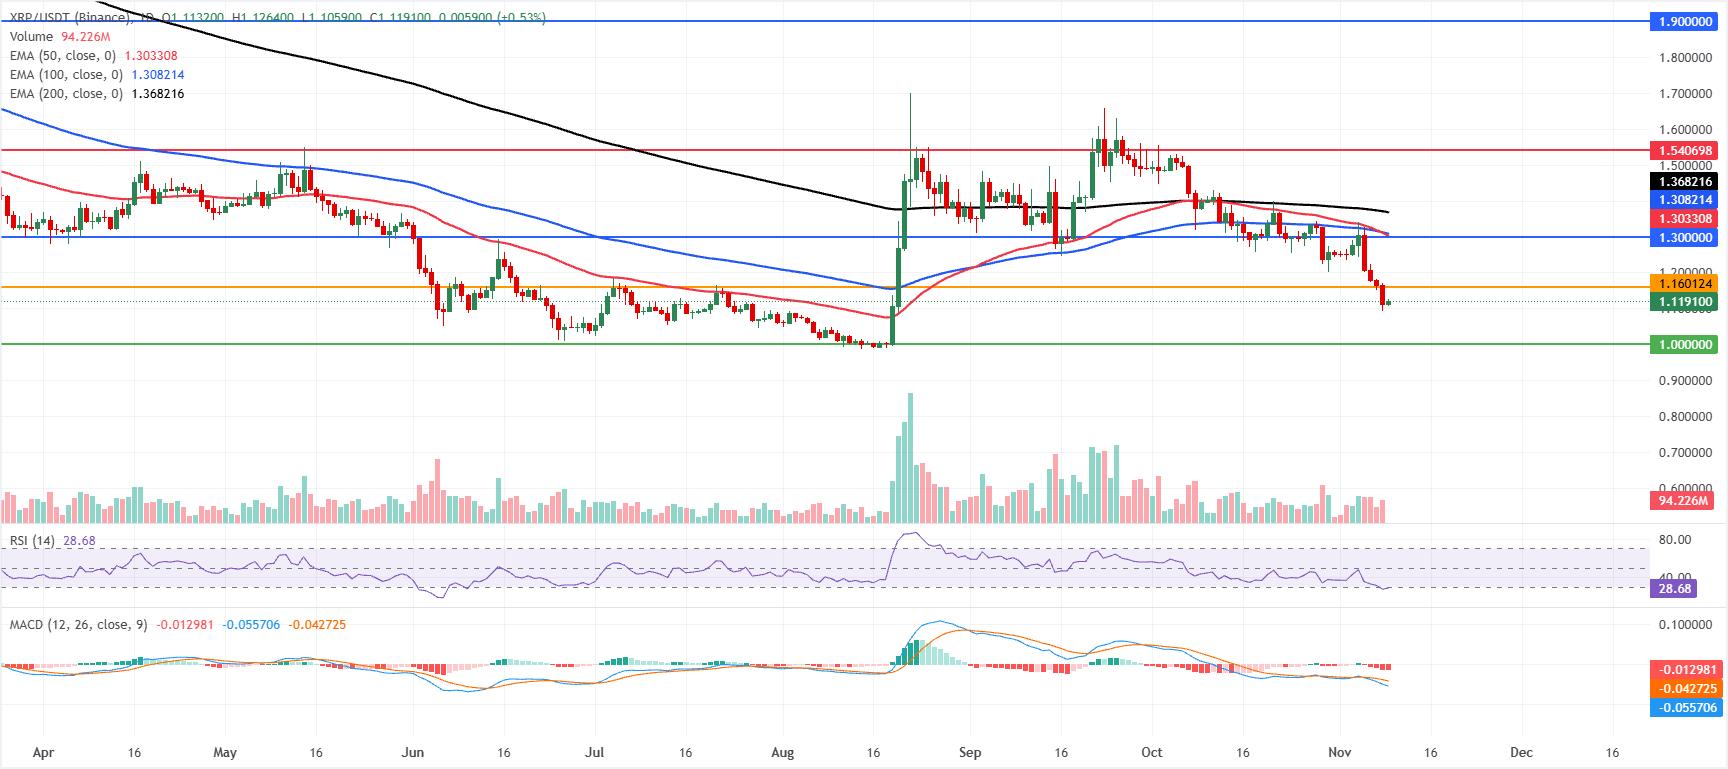
XRP price trades at $1.119 on Monday, extending a bearish near-term tone as it holds well below the 50-day, 100-day and 200-day EMAs clustered between roughly $1.303 and $1.368.
The Relative Strength Index (RSI) at 28 sits in oversold territory. At the same time, the Moving Average Convergence Divergence (MACD) indicator remains negative, which together hint at persistent downside pressure even as the market risks a short-term pause or modest bounce from depressed levels.
On the topside, initial resistance appears at $1.160, ahead of a stronger cap near $1.300 and the nearby EMA cluster between the 50-day EMA at $1.303 and the 100-day EMA at $1.308; beyond that, the 200-day EMA at $1.368 and horizontal levels at $1.540 and $1.900 define higher barriers.
On the downside, the nearest meaningful support is located at the psychological $1.000 handle, where a break would likely expose the pair to a deeper bearish extension in the sessions ahead.
(The technical analysis of this story was written with the help of an AI tool. Know more.)