
Markets navigated several themes on Wednesday as traders juggled a cocktail of inflation surprises & Fed drama. The big action of the day surrounded anonymous reports of Trump potentially firing Fed Chair Powell, sending ripples through all of the major markets and creating very mixed outcomes from the usual market correlations.
Here are headlines you may have missed in the last trading sessions!
Headlines:
- Japan Reuters Tankan Index for July 2025: 7.0 (7.0 forecast; 6.0 previous)
-
U.K. Consumer Price Index Growth Rate for June 2025: 0.3% m/m (0.4% m/m forecast; 0.2% m/m previous); 3.6% y/y (3.5% y/y forecast; 3.4% y/y previous)
- U.K. Core Consumer Price Index Growth Rate for June 2025: 3.7% y/y (3.6% y/y forecast; 3.5% y/y previous); 0.4% m/m (0.3% m/m forecast; 0.2% m/m previous)
- Euro area Trade Balance for May 2025: 16.2B (11.5B forecast; 9.9B previous)
- U.S. MBA Mortgage Applications for July 11, 2025: -10.0% (9.4% previous)
- U.S. MBA 30-Year Mortgage Rate for July 11, 2025: 6.82% (6.77% previous)
- Canada Housing Starts for June 2025: 283.7k (260.0k forecast; 279.5k previous)
-
U.S. Producer Price Index Growth Rate for June 2025: 2.3% y/y (2.6% y/y forecast; 2.6% y/y previous); 0.0% m/m (0.3% m/m forecast; 0.1% m/m previous)
- U.S. Core Producer Price Index Growth Rate for June 2025: 0.0% m/m (0.3% m/m forecast; 0.1% m/m previous); 2.6% y/y (2.8% y/y forecast; 3.0% y/y previous)
- U.S. Industrial Production for June 2025: 0.3% m/m (0.3% m/m forecast; -0.2% m/m previous); 0.7% y/y (1.5% y/y forecast; 0.6% y/y previous)
- U.S. Manufacturing Production for June 2025: 0.8% y/y (1.1% y/y forecast; 0.5% y/y previous); 0.1% m/m (0.2% m/m forecast; 0.1% m/m previous)
- U.S. Capacity Utilization Rate for June 2025: 77.6% (77.4% forecast; 77.4% previous)
- U.S. EIA Crude Oil Stocks Change for July 11, 2025: -3.86M (7.07M previous)
- The broad markets whipsawed on Wednesday, surrounding an anonymous report of US President Trump moving to fire Fed Chair Powell soon, which was soon dismissed by Trump
Broad Market Price Action:

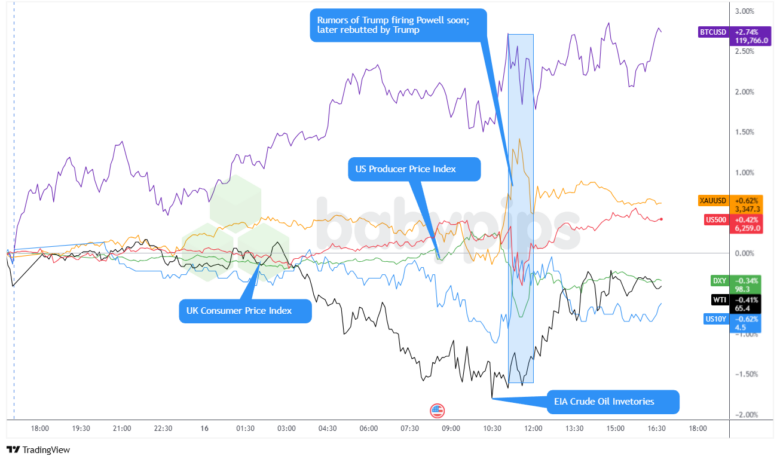
Dollar Index, Gold, S&P 500, Oil, U.S. 10-yr Yield, Bitcoin Overlay Chart by TradingView
After a relatively quiet Asia and London session, market sentiment became all about two main storylines that probably had traders glued to their screens: Trump’s brief flirtation with firing Fed Chair Powell and some surprisingly soft inflation data that caught everyone off guard.
BTC continued to rebound on Wednesday, surging over 2.74% to nearly retest $120K. There didn’t seem to be a direct fresh driver for the one way move higher, so it’s likely bitcoin bulls continued to hop in on growing institutional adoption and bitcoin ETF demand, and possibly on speculation of crypto friendly regulation coming to the U.S. (despite the stumbles we’re currently seeing with lawmakers on the issues).
Gold managed a decent 0.62% gain, probably benefiting from the political uncertainty around Fed leadership, and likely persistent inflation concerns, as signaled by the spike higher (then pullback) during the U.S. session.
Meanwhile, the US 10-Year yield took a notable -0.62% tumble during the U.S. session, suggesting bond traders were pricing in reduced tightening pressure after that flat PPI reading (versus the expected 0.2% jump).
The S&P 500’s modest 0.42% climb likely reflects relief after Trump quickly walked back the Powell firing talk, combined with the softer wholesale inflation data potentially giving the Fed more wiggle room on future rate decisions.
The U.S. Dollar Index’s -0.34% slide makes sense given the combination of falling yields and softer inflation data, which typically reduces demand for dollar-denominated assets.
Oil’s -0.41% drop ahead of the EIA inventory report was probably just pre-positioning, with traders possibly expecting another build in crude stockpiles. That bearish pressure quickly faded after the EIA reported a 3.9 million barrel draw in inventory, prompting oil to recover a big portion of its losses, but still close lower on the session.
FX Market Behavior: U.S. Dollar vs. Majors:

Overlay of USD vs. Majors Chart by TradingView
The US dollar traded mostly sideways through the Asia and London sessions, possibly due to traders taking a breather after a wild Tuesday reaction to the latest CPI data, and holding off on fresh trades in anticipation of U.S. PPI data.
And as expected, that’s when the real action started to come. June producer price index came in flat versus expectations of a 0.2% increase, sending an initial bearish signal for the dollar. Softer wholesale inflation boosted demand for Treasuries and yields retreated, with the 10-year falling to 4.462% and the two-year to 3.930%.
The dollar initially sold off on the PPI miss, then rebounded ahead of the equity open as traders possibly used that as an opportunity to focus on the very strong CPI outcome and implications from just a day before.
But fortunately for USD bears, traders were hit by news reports from an anonymous source that Trump seemed to be on the verge of firing Fed Chair Powell. This stemmed from a closed-door meeting with Republican lawmakers on Tuesday, where Trump polled GOP members about whether he should fire Fed Chair Jerome Powell. This sent the U.S. dollar and bonds lower immediately as traders questioned Fed independence, crushing equities as well as the 30-year bond yields spiked above 5%.
Of course, the drama didn’t end there as Trump quickly walked back the headlines, stating that the administration is not planning on doing anything on that matter and that it’s “highly unlikely” Powell will be removed. USD quickly recovered on that development, but only to take enough of its losses on the day to close slightly lower against most of the major currencies for the session.
Upcoming Potential Catalysts on the Economic Calendar
- New Zealand Food Price Index for June 2025 at 10:45 pm GMT
- Japan Balance of Trade for June 2025 at 11:50 pm GMT
- Australia Consumer Inflation Expectations for July 2025 at 1:00 am GMT
-
Australia Employment Change for June 2025 at 1:30 am GMT
- Australia Unemployment Rate for June 2025 at 1:30 am GMT
- Swiss Balance of Trade for June 2025 at 6:00 am GMT
- U.K. Employment Change for May 2025 at 6:00 am GMT
- Euro area Consumer Price Index Growth Rate Final for June 2025 at 9:00 am GMT
- Canada CFIB Business Barometer for July 2025 at 11:00 am GMT
- Canada Foreign Securities Purchases for May 2025 at 12:30 pm GMT
- U.S. Initial Jobless Claims for July 12, 2025 at 12:30 pm GMT
- U.S. Retail Sales for June 2025 at 12:30 pm GMT
- U.S. Import & Export Prices for June 2025 at 12:30 pm GMT
- U.S. Philadelphia Fed Manufacturing Index for July 2025 at 12:30 pm GMT
- U.S. NAHB Housing Market Index for July 2025 at 2:00 pm GMT
- U.S. Fed Kugler Speech at 2:00 pm GMT
- U.S. TIC Net Long-Term Transactions for May 2025 at 8:00 pm GMT
- U.S. Fed Balance Sheet for July 16, 2025 at 8:30 pm GMT
- U.S. Fed Waller Speech at 10:30 pm GMT
- Japan Inflation Rate Ex-Food and Energy YoY for June 2025 at 11:30 pm GMT
Australia Employment (1:30am GMT) will be crucial for RBA policy direction after their surprise rate hold at 3.85%. Strong jobs data could reinforce the central bank’s hawkish stance and delay easing expectations.
UK Employment data comes amid recession concerns following May’s GDP contraction and growing expectations for BOE rate cuts in August. Weak employment figures could accelerate dovish bets.
US Initial Jobless Claims should continue showing labor market resilience, with previous reading at 227k vs 245k forecast. Persistent strength would support the Fed’s cautious approach to rate cuts amid tariff-driven inflation concerns.
As always, stay nimble and don’t forget to check out our Forex Correlation Calculator when taking any trades!

