
WTI crude oil recently fell through its ascending channel support, suggesting that a reversal from the climb could be in the works.
Will more sellers hop in on these pullback levels?

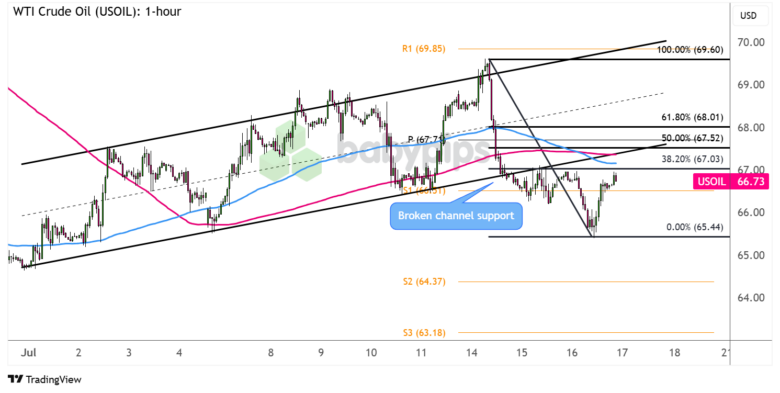
WTI Crude Oil 1-hour Chart by TradingView
Easing geopolitical tensions appear to have taken WTI crude oil out of its uptrend during the first half of July while resurfacing global trade jitters also weighed on the demand outlook for the commodity.
With that, price fell through support around $67 per barrel and may be looking into a possible trend reversal.
Will the area of interest at the former channel bottom hold as resistance?
Remember that directional biases and volatility conditions in market price are typically driven by fundamentals. If you haven’t yet done your fundie homework on WTI crude oil and the U.S. dollar, then it’s time to check out the economic calendar and stay updated on daily fundamental news!
The energy commodity is closing in on the 38.2% Fibonacci retracement level near the 100 SMA dynamic resistance, which is below the 200 SMA to suggest that the path of least resistance is to the downside.
A larger correction could reach the 50% Fib at $67.52 per barrel near the pivot point level ($67.71) or the 61.8% retracement at $68.01 per barrel. Look out for reversal candlesticks at any of these areas that could indicate sellers are ready to resume the slide back to the swing low or lower.
Sustained bearish pressure could drag crude oil down to S2 ($64.37) then S3 ($63.18) next while a strong surge in buying momentum could spur a break above the Fib levels and a continuation of the uptrend back to the channel top.
Whichever bias you end up trading, don’t forget to practice proper risk management and stay aware of top-tier catalysts that could influence overall market sentiment.
Disclaimer:
Please be aware that the technical analysis content provided herein is for informational and educational purposes only. It should not be construed as trading advice or a suggestion of any specific directional bias. Technical analysis is just one aspect of a comprehensive trading strategy. The technical setups discussed are intended to highlight potential areas of interest that other traders may be observing. Ultimately, all trading decisions, risk management strategies, and their resulting outcomes are the sole responsibility of each individual trader. Please trade responsibly.

