
Bitcoin retreated after testing its all-time highs, but it looks like bullish pressure is still in play while a new ascending triangle is forming.
Take a look at these potential support zones!

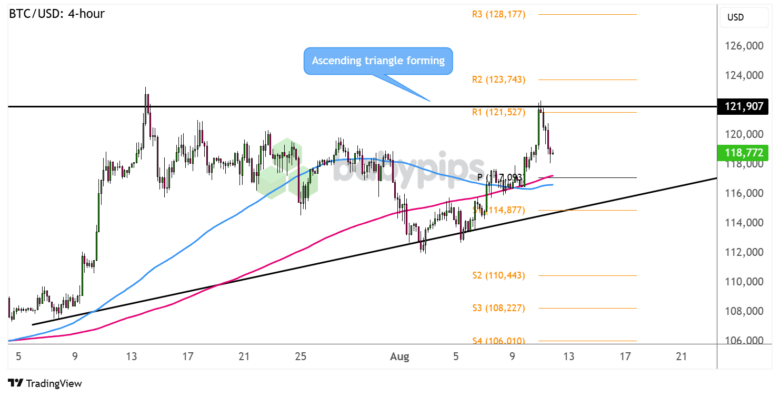
Bitcoin (BTC/USD) 4-hour Forex Chart by TradingView
Bitcoin has been forming higher lows since July but appears to be hitting a solid roadblock around R1 ($121,527), as bulls likely booked profits at the record highs.
Price could be in for another test of near-term support levels, with more buyers probably waiting to hop in the uptrend.
Or will we see a triangle breakdown next?
Remember that directional biases and volatility conditions in market price are typically driven by fundamentals. If you haven’t yet done your fundie homework on Bitcoin and the U.S. dollar, then it’s time to check out the economic calendar and stay updated on daily fundamental news!
BTC/USD is closing in on the floor around the pivot point level ($117,093) which happens to be in line with the dynamic support at the moving averages. The 100 SMA just crossed below the 200 SMA, though, hinting that bearish momentum could be picking up.
Keep an eye out for a break below the triangle bottom and S1 ($114,877) that could point to a potential downtrend lasting by the same height as the chart formation, dragging bitcoin down to S2 ($110,443) then S3 ($108,227).
On the other hand, a bounce off the triangle support or nearby support zones could spur another test of the all-time highs and perhaps a break higher to R2 ($123,743) then R3 ($128,177). Look out for the highly-anticipated U.S. CPI report that could dictate dollar direction from here.
Whichever bias you end up trading, don’t forget to practice proper risk management and stay aware of top-tier catalysts that could influence overall market sentiment.
Disclaimer:
Please be aware that the technical analysis content provided herein is for informational and educational purposes only. It should not be construed as trading advice or a suggestion of any specific directional bias. Technical analysis is just one aspect of a comprehensive trading strategy. The technical setups discussed are intended to highlight potential areas of interest that other traders may be observing. Ultimately, all trading decisions, risk management strategies, and their resulting outcomes are the sole responsibility of each individual trader. Please trade responsibly.
This content is strictly for informational purposes only and does not constitute as investment advice. Trading any financial market involves risk. Please read our Risk Disclosure to make sure you understand the risks involved.

