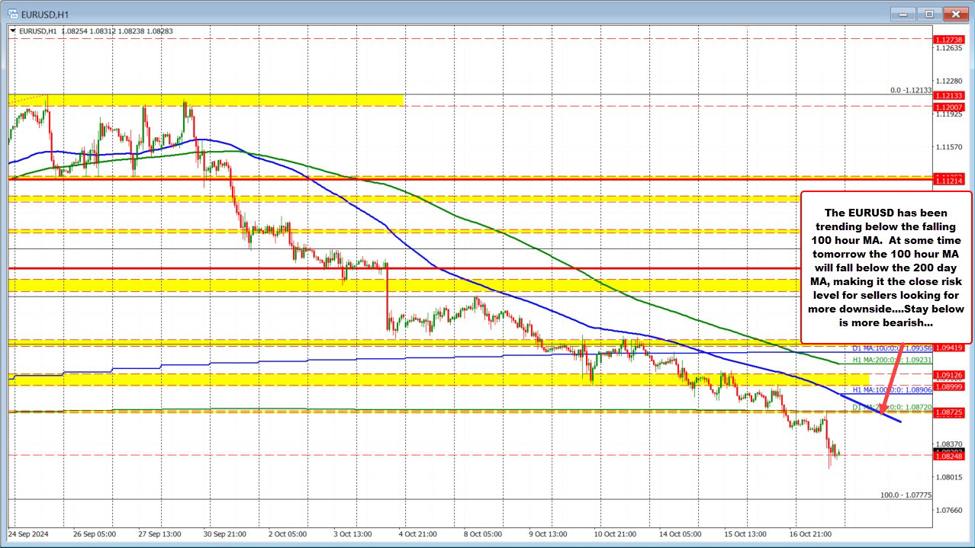
The EURUSD has been trending to the downside recently, and in the process has extended toward August low levels.
My most recent technical videos on the pair, have been focused on the 4-hour chart as the market trended lower.
If you watch the kickstart video from earlier today I also spoke to the 200-day moving average which was broken yesterday and retested today on a correction, before reversing back to the downside and reaching to new session lows. That break and test increases the levels importance going forward. It would take a move above it to shift the bias back to the upside – at least in the short term.
In this video, I start by looking at the same 4-hour chart but then transition to the hourly chart (see below) as it shows the trending nature of the market, AND the potential impact of the falling 100-hour moving average (blue line on the chart below). That MA is quickly approaching the 200-day MA at 1.0872, and at some point tomorrow, will crossover the 200-day MA.
When that happens, the focus will shift to the 100-hour MA as the closest risk and bias-defining level. Stay below the 100 hour MA, would keep the sellers in firm control. Move above, and the short-term bias shifts to the buyers with the 200 day MA as another target to get to and through for the buyers to take back more control.
Putting it another way, until the 100 hour MA is broken, the sellers are still trending and the technical bias is still to the downside.
Fundamentally, the ECB cut rates by 25 basis points today. ECBs Lagarde’s comments were not exactly positive. Nevertheless, she also stressed how the central bank was still data dependent (despite the view that the data was more negative with lower inflation). With the US data today still showing solid growth with the Atlanta Fed now forecasting 3.4% growth in third-quarter.
That should keep the fundamental bias to the downside.


