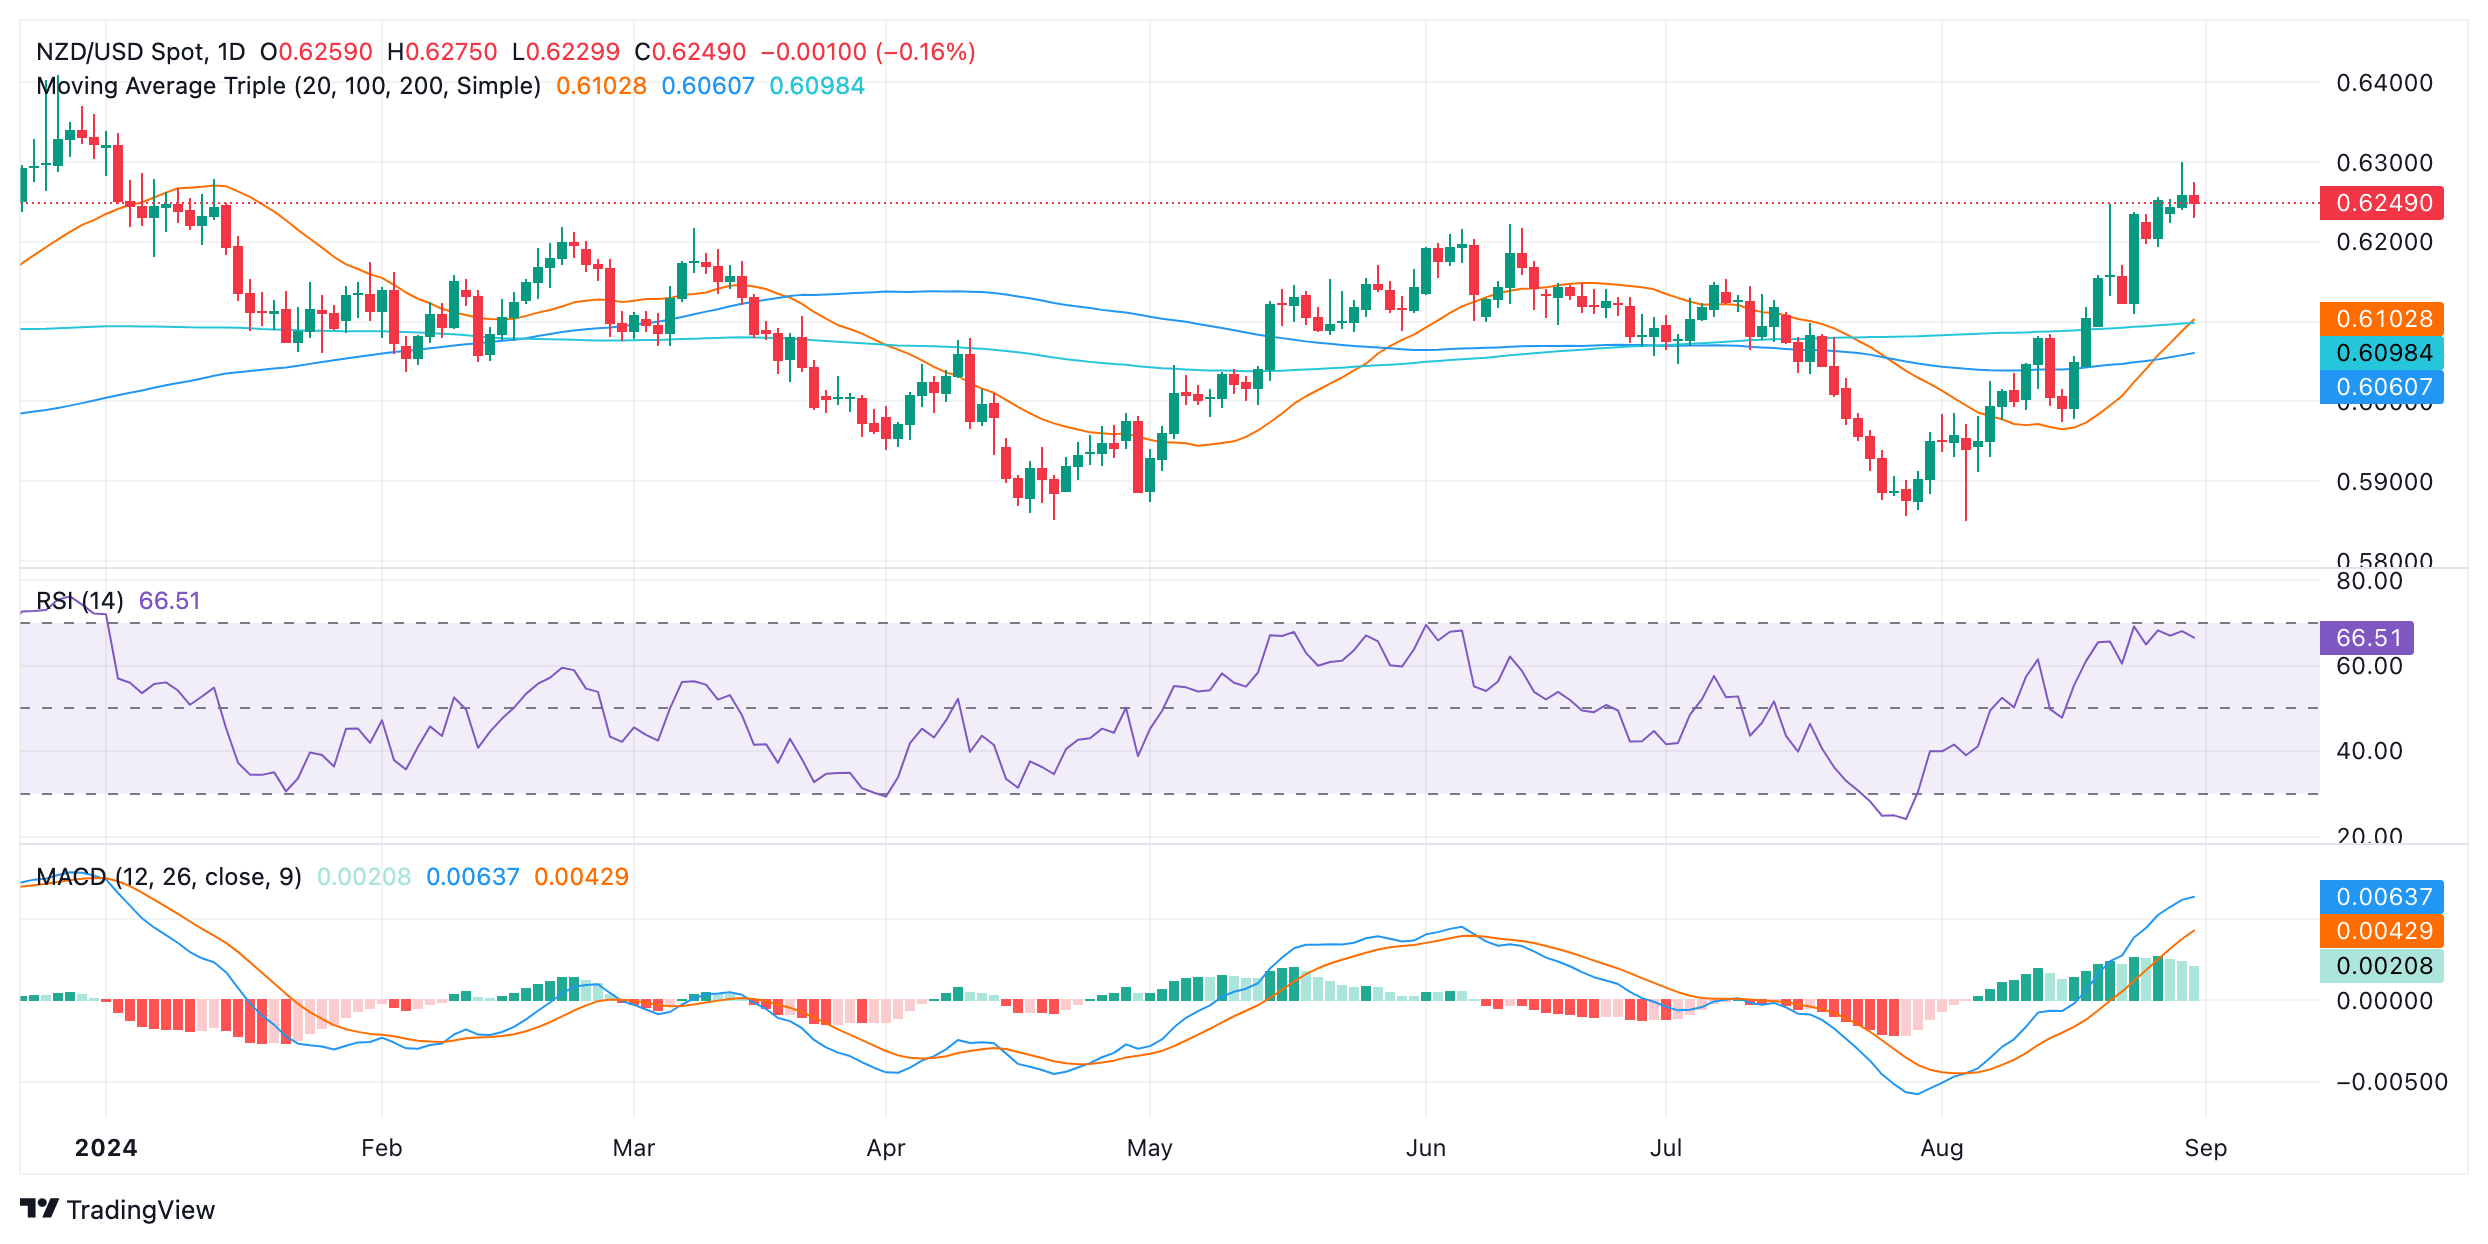
- NZD/USD and declined by 0.15% to 0.6250 in Friday’s session
- The RSI is near 70, indicating the pair is overbought and vulnerable to selling pressure.
- The MACD is showing decreasing green bars, suggesting weakening bullish momentum.
The NZD/USD pair declined to 0.6250 in Friday’s session, retreating from recent highs. The technical indicators suggest a potential correction in the near term.
The Relative Strength Index (RSI) is currently at 66, indicating that the pair is near the overbought threshold which may suggest that selling pressure could emerge soon. Furthermore, the Moving Average Convergence Divergence (MACD) is showing decreasing green bars, indicating that the bullish momentum is weakening. The volume has been declining in recent sessions, which could be a sign of waning interest in the NZD/USD pair.
NZD/USD daily chart

The NZD/USD pair is facing supports at the 0.6230-0.6200 zone which could be used to consolidate in the coming sessions as a healthy correction is necessary before the next upward leg. A break below the 0.6200 support could flash an alarm but the outlook by now is bullish.
