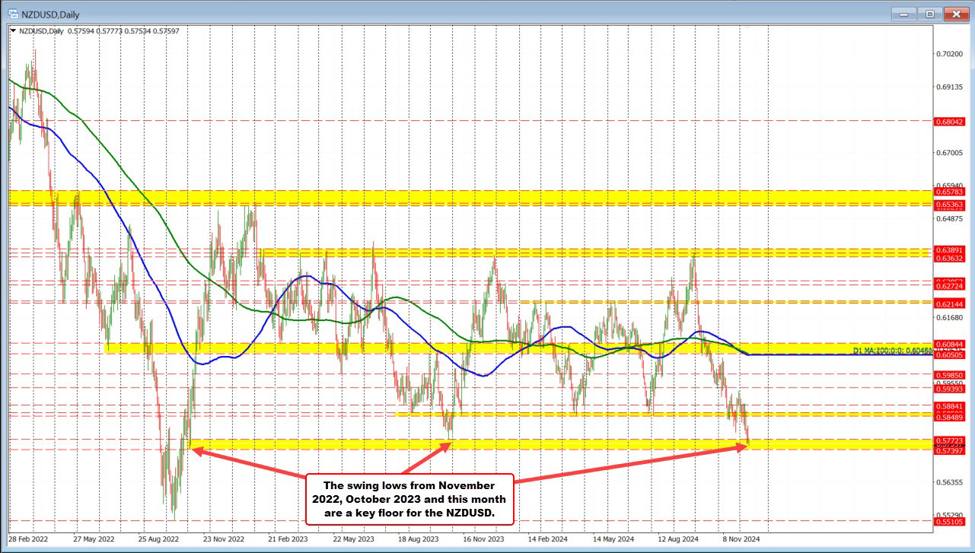
The NZDUSD is trading at a new 2024 low today, reaching 0.5753, positioning the price near the midpoint of key swing lows from November 2022 and end of October 2023:
- 0.5739 (November 2022 low)
- 0.5772 (October 2023 low)
A break below this support area would strengthen the bearish bias, encouraging traders to probe lower levels. Conversely, holding support and moving back above 0.5772 could indicate the start of another corrective rally, similar to those seen from the November 2020 and October 2023 lows.
Key Levels and Technical Signals
Upside Targets (for a corrective move):
- 0.5796: Swing low from November 26.
- 0.5800: Falling 100-hour moving average and psychological resistance level.
- 0.5814: Swing level above 0.5800.
- 0.5829: Falling 200-hour moving average.
- 0.5862: 38.2% retracement of the November decline. Breaking above this level would shift momentum and give sellers a reason to pause.
Downside Risk:
- A break below 0.5739 would confirm the bearish continuation, increasing the likelihood of deeper declines.
Summary
The immediate focus is on whether the 0.5739–0.5772 support zone holds or breaks.
- Above 0.5800: Signals a potential corrective rally, with upside targets aligning with key moving averages and resistance levels.
- Below 0.5739: Confirms continued bearish momentum, with lower lows in sight.


