- The Japanese Yen appreciates due to the hawkish speech by the BoJ Governor Ueda in Parliament.
- The USD/JPY pair loses ground due to differing policy outlooks between the two central banks.
- The US Dollar lost ground following the dovish stance of the Fed Chair Powell at the Jackson Hole Symposium.
The Japanese Yen (JPY) continues to strengthen for the second consecutive day as Bank of Japan Governor Kazuo Ueda’s hawkish remarks contrast with Federal Reserve Chair Jerome Powell’s dovish stance.
BoJ Governor Ueda stated in Parliament on Friday that the central bank could raise interest rates further if its economic projections are accurate. Additionally, July’s National Consumer Price Index (CPI) inflation data remained at its highest level since February, reinforcing the BoJ’s hawkish stance on its policy outlook.
The US Dollar (USD) depreciates due to rising odds of a rate cut in September. Fed Chair Jerome Powell stated at the Jackson Hole Symposium, “The time has come for policy to adjust.” Although, Powell did not specify when rate cuts would begin or their potential size.
Traders anticipate the US central bank may reduce rates by atleast 25 basis points in September. According to the CME FedWatch Tool, markets are now fully anticipating at least a 25 basis point (bps) rate cut by the Federal Reserve at its September meeting.
Daily Digest Market Movers: Japanese Yen rises due to a hawkish statement by BoJ Ueda
- Bloomberg reported on Friday that Philadelphia Fed President Patrick Harker emphasized the need for the US central bank to lower interest rates gradually. Meanwhile, Reuters reported Chicago Fed President Austan Goolsbee noted monetary policy is currently at its most restrictive, with the Fed now focusing on achieving its employment mandate.
- Bank of Japan (BoJ) Governor Kazuo Ueda addressed the Japanese parliament on Friday, stating that he is “not considering selling long-term Japanese government bonds (JGBs) as a tool for adjusting interest rates.” He noted that any reduction in JGB purchases would only account for about 7-8% of the balance sheet, which is a relatively small decrease. Ueda added that if the economy aligns with their projections, there could be a phase where they might adjust interest rates slightly further.
- Japan’s National Consumer Price Index increased by 2.8% year-on-year in July, maintaining this rate for the third consecutive month and remaining at its highest level since February. Additionally, the National CPI excluding Fresh Food rose by 2.7%, the highest reading since February, aligning with expectations.
- The US Composite PMI edged down to 54.1 in August, a four-month low, from 54.3 in July, but remained above market expectations of 53.5. This indicates continued expansion in US business activity, marking 19 consecutive months of growth.
- FOMC Minutes for July’s policy meeting indicated that most Fed officials agreed last month that they would likely cut their benchmark interest rate at the upcoming meeting in September as long as inflation continued to cool.
Technical Analysis: USD/JPY depreciates to near 144.00
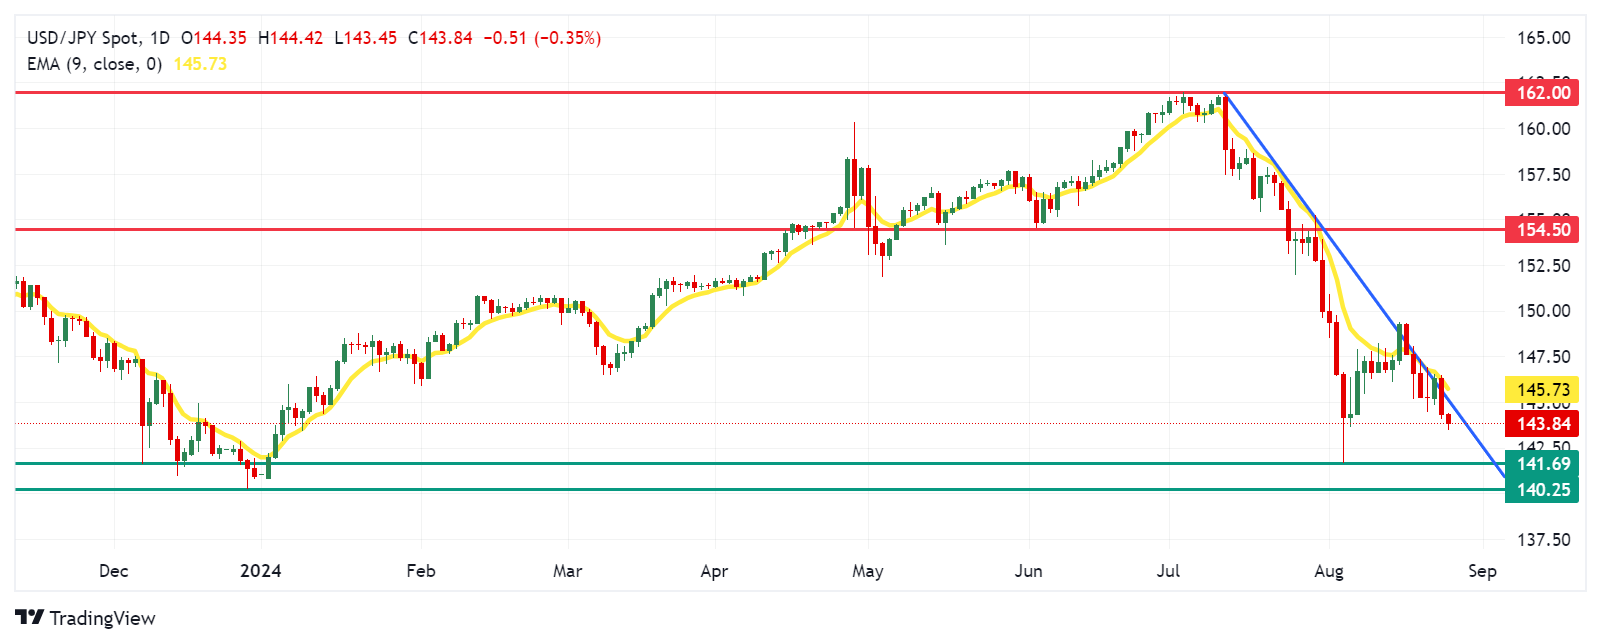
USD/JPY trades around 143.90 on Friday. Analysis of the daily chart shows that the pair is positioned below a downtrend line, suggesting a bearish bias. However, the 14-day Relative Strength Index (RSI) remains slightly above 30, indicating that the bearish trend may continue.
On the downside, the USD/JPY pair may navigate the region around the seven-month low of 141.69, which was recorded on August 5. A break below this level could drive the pair toward the throwback support level at 140.25.
In terms of resistance, the USD/JPY pair may test the immediate barrier at the downtrend line around the psychological level of 145.00, followed by the nine-day Exponential Moving Average (EMA) at the 145.74 level. A breakthrough above the nine-day EMA could support the pair to explore the region around the throwback-turned-resistance at 154.50 level.
USD/JPY: Daily Chart
Japanese Yen PRICE Today
The table below shows the percentage change of Japanese Yen (JPY) against listed major currencies today. Japanese Yen was the strongest against the New Zealand Dollar.
| USD | EUR | GBP | JPY | CAD | AUD | NZD | CHF | |
|---|---|---|---|---|---|---|---|---|
| USD | 0.07% | 0.13% | -0.17% | 0.00% | 0.30% | 0.18% | -0.06% | |
| EUR | -0.07% | 0.00% | -0.24% | -0.05% | 0.14% | 0.11% | -0.11% | |
| GBP | -0.13% | -0.01% | -0.36% | -0.12% | 0.13% | 0.04% | -0.17% | |
| JPY | 0.17% | 0.24% | 0.36% | 0.21% | 0.57% | 0.59% | 0.22% | |
| CAD | -0.01% | 0.05% | 0.12% | -0.21% | 0.28% | 0.21% | -0.07% | |
| AUD | -0.30% | -0.14% | -0.13% | -0.57% | -0.28% | -0.03% | -0.25% | |
| NZD | -0.18% | -0.11% | -0.04% | -0.59% | -0.21% | 0.03% | -0.23% | |
| CHF | 0.06% | 0.11% | 0.17% | -0.22% | 0.07% | 0.25% | 0.23% |
The heat map shows percentage changes of major currencies against each other. The base currency is picked from the left column, while the quote currency is picked from the top row. For example, if you pick the Japanese Yen from the left column and move along the horizontal line to the US Dollar, the percentage change displayed in the box will represent JPY (base)/USD (quote).


