- Gold weakens after data shows a sharp fall in Chinese exports.
- Chinese military drills in the strait of Taiwan and fiscal stimulus supports Gold.
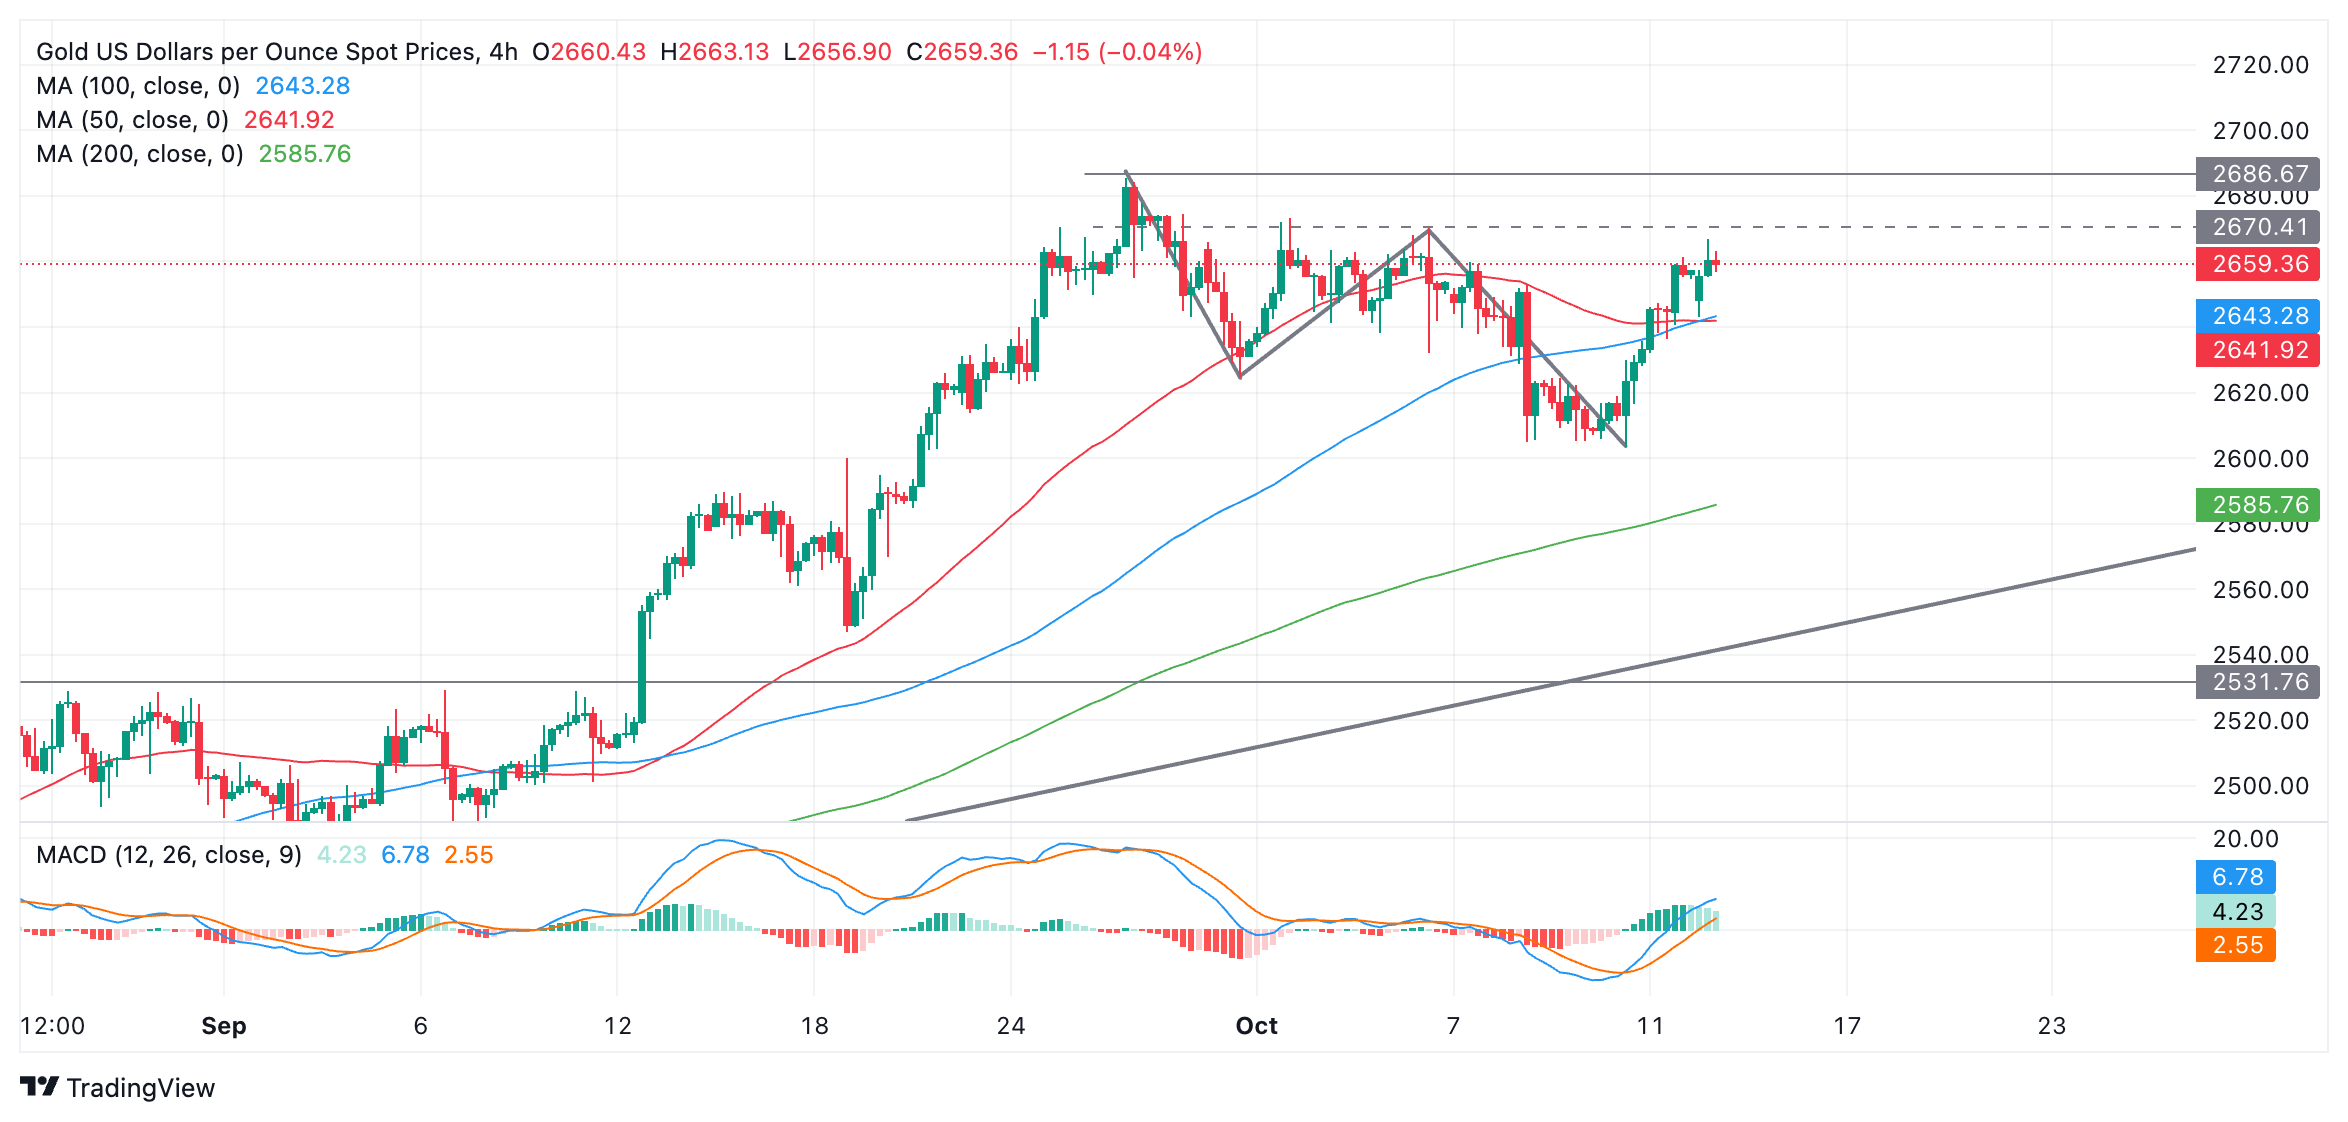
- Technically, XAU/USD reaches a key resistance level at the top of its multi-week range.
Gold (XAU/USD) weakens into the $2,650s on Monday after data shows a a slide in Chinese exports, suggesting broader strains on the world’s second largest economy and its largest market for Gold.
Gold impacted by China factors
China Exports rose 2.4% in September, well below the 8.7% of the previous month and 6.0% expected. The slowdown led to a trade balance of $81.71 billion – below both the porevious month and estimates. The data further indicated a slowdown in the Chinese economy which could damage demand for Gold in the country.
Earlier on Monday Gold rose amid rising safe-haven demand after saber-rattling by the Chinese People’s Liberation Army (PLA) in the strait of Taiwan. This prompted a spokesperson from the US Department of State to say on Monday, that they were “seriously concerned” with the PLA’s activities in around Taiwan.
On Saturday, Chinese Finance Minister Lan Fo’an announced a much-anticipated fiscal stimulus programme. Although no figures were given, he said Beijing would help regional governments tackle their debt problems with a large-scale local government debt swap.
Lan further suggested the government’s stimulus package could mark a multi-year turning point in China’s “fiscal policy framework”.
More central bank rate cuts in the pipeline
A bullish driver for Gold is the continued downward projected path of interest rates globally. The European Central Bank (ECB) will conclude its October meeting on Thursday and most analysts expect the bank to announce another 25 basis point (bps) (0.25%) rate cut – their second cut in a row. Such a move would signal a significant “gear change up” in terms of the pace and timing of the ECB’s easing cycle.
In the US, meanwhile, investors expect a 25 bps rate cut from the Federal Reserve (Fed) in November after US Producer Price Index (PPI) inflation data on Friday showed headline PPI was unchanged on a monthly basis in September – missing expectations of a 0.1% increase and the prior month’s 0.2% reading. Core PPI inflation, which excludes volatile food and energy prices, slowed to 0.2% from 0.3% in August.
Annual readings, however, resulted mixed, as PPI decelerated while core PPI rose by 2.8%, above the prior month’s 2.6%. Although mixed annual performance, the monthly readings weighed, as did the preliminary US Michigan Consumer Sentiment Index for October, which fell below September’s reading and analysts’ estimates.
The CME FedWatch Tool is showing the markets are now pricing in around a 90% chance of a 25 bps Fed rate cut – up from 83% before the PPI data.
Technical Analysis: Gold on the rise
Gold appears to have completed a correction at the October 10 lows and has been rising since then.
It has reached a resistance level at around $2,670 from a row of previous highs including the October 1 and 4 highs (dashed line). A close above would probably lead to a continuation up to the $2,685 all-time high.
XAU/USD 4-hour Chart
The Moving Average Convergence Divergence (MACD) has risen above the zero line and is in positive territory, which is a mildly bullish indication.
There is also a chance the pair could bounce off resistance and start pulling back down into its familiar range between $2,620 and $2,670. This would extend the range-bound move seen since late September.
Gold’s medium and long-term trends are also bullish. If one of these longer-term cycles resumes, it could, in theory, push the asset to even higher highs.

