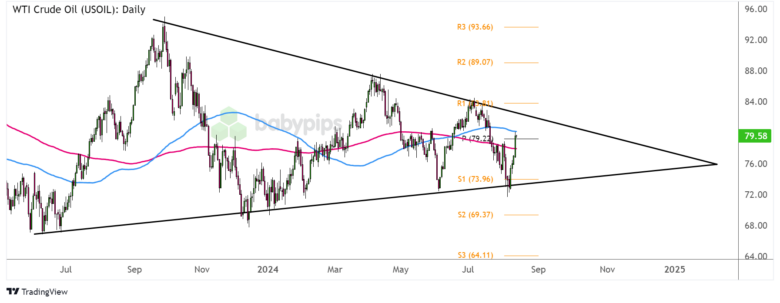
Crude oil has been on a tear these days, but can it sustain its climb past this major resistance zone?
And if so, just how high can it go?
Check out this long-term chart pattern on my radar!

WTI Crude Oil (USOIL) Daily Chart by TradingView
Crude oil has formed lower highs and higher lows since July last year, creating a symmetrical triangle visible on its daily chart.
Price staged a strong bounce off the triangle bottom and seems to be halfway through on its climb to the top, encountering some resistance at the pivot point level ($79.22 per barrel) and the 100 SMA dynamic inflection point.
Can it go further north from here?
Remember that directional biases and volatility conditions in market price are typically driven by fundamentals. If you haven’t yet done your homework on crude oil and market sentiment, then it’s time to check out the economic calendar and stay updated on daily fundamental news!
News of worsening geopolitical conflict in the Middle East are stoking supply concerns once more, driving the energy commodity higher on expectations of production disruptions in case attacks escalate.
However, the spotlight could soon shift to overall risk sentiment spurred by U.S. inflation updates, as the upcoming CPI release could still affect Fed interest rate cut expectations. While the possibility of a September easing move appears to be baked in, traders are still divided on the magnitude of the potential cut.
A return in risk appetite stemming from expectations of a larger reduction in U.S. borrowing costs could encourage crude oil bulls to charge, potentially taking the commodity price past the triangle top and onto R1 ($83.81 per barrel) and beyond.
On the other hand, stronger than expected U.S. inflation figures could dampen easing expectations for the rest of the year and potentially drag risk assets lower.
In crude oil’s case, look out for reversal candlesticks at current levels or the triangle resistance, as this could take the commodity back down to support near S1 ($73.96 per barrel).
