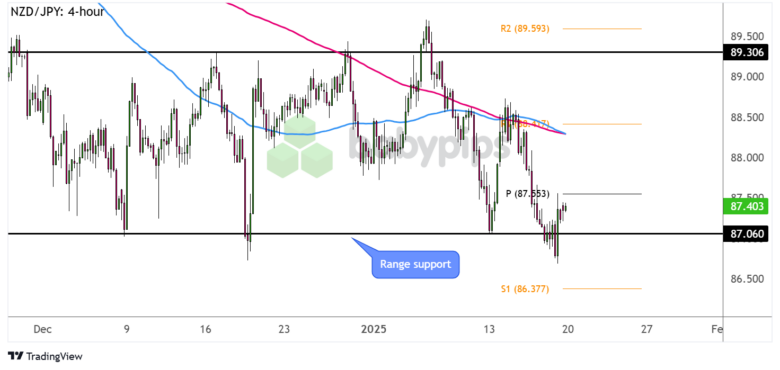
Just when it seemed that this pair dipped below its long-term range bottom, price jumped back above the support zone!
Can it keep losses in check from here?
Look at these inflection points I’m watching on the 4-hour time frame:

NZD/JPY 4-hour Forex Chart by TradingView
Shifting monetary policy expectations for both the Reserve Bank of New Zealand (RBNZ) and the Bank of Japan (BOJ) have kept NZD/JPY pacing back and forth inside a range since December last year.
At the same time, risk appetite switching on and off over the past few weeks have allowed support around the 87.00 mark and resistance near the 89.50 minor psychological level to hold.
The pair appeared to dip below the range support on stronger BOJ hike expectations, but it looks like Kiwi bulls are still putting up a fight.
Can NZD/JPY bounce back to the range resistance next?
Remember that directional biases and volatility conditions in market price are typically driven by fundamentals. If you haven’t yet done your homework on the New Zealand dollar and the Japanese yen, then it’s time to check out the economic calendar and stay updated on daily fundamental news!
The 100 SMA appears to be crossing below the 200 SMA to suggest that support is more likely to break than to hold, possibly sending the pair lower by the same height as the range pattern.
Keep an eye out for long red candlesticks closing below S1 (86.37) as additional confirmation that sellers are regaining the upper hand.
On the other hand, if support holds and the pair is able to climb back above the pivot point level (87.55), look out for a continuation of the rally back to the upside targets at R1 (88.41) then the top of the range.
Whichever bias you end up trading, don’t forget to practice proper risk management and stay aware of top-tier catalysts that could influence overall market sentiment!

