
Shifting market sentiment has kept gold in consolidation for quite some time, but is the precious metal gearing up for a big break soon?
Or will we see further sideways price action from here?
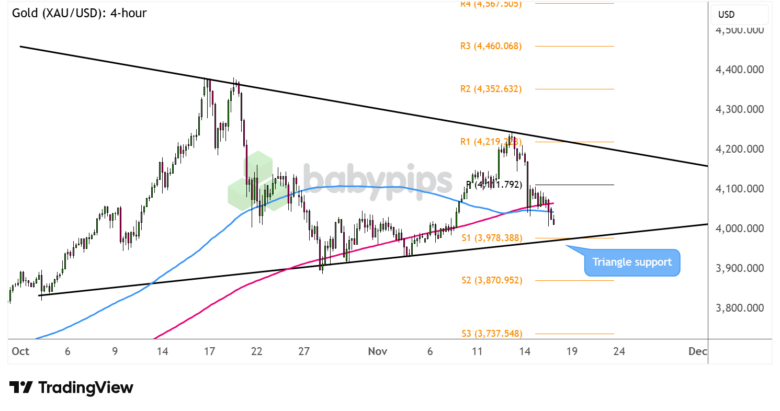
Check out this triangle pattern on the 4-hour time frame!

Gold (XAU/USD) 4-hour Chart by TradingView
After its stellar record-breaking rally back in September, gold has eased back in consolidation over the past month as it formed lower highs and higher lows inside a symmetrical triangle pattern.
Safe-haven flows seem to have slowed, as markets have found some relief from the U.S. government reopening while global trade tensions are also simmering.
Are we about to see a bounce or a breakdown as XAU/USD closes in on its triangle support?
Remember that directional biases and volatility conditions in market price are typically driven by fundamentals. If you haven’t yet done your fundie homework on the gold and the U.S. dollar, then it’s time to check out the economic calendar and stay updated on daily fundamental news!
Gold seems to be within striking distance of the triangle bottom near S1 ($3,978.38) while a bearish moving average crossover has just materialized.
Keep an eye out for long red candlesticks suggesting further downside, as a move below the support zone could take the precious metal down to the next bearish targets at S2 ($3,870.95) then S3 ($3,737.54).
On the other hand, reversal candles around the triangle support could suggest that gold bulls are ready to charge again, possibly taking price back up to the resistance levels at the pivot point ($4,111.79) then the triangle top near R1 ($4,219.22).
Top-tier U.S. economic catalysts, including the release of the FOMC minutes and the NFP report, are likely to influence risk appetite and dollar direction so be ready for potentially large swings!
Whichever bias you end up trading, don’t forget to practice proper risk management and stay aware of top-tier catalysts that could influence overall market sentiment.
Disclaimer:
Please be aware that the technical analysis content provided herein is for informational and educational purposes only. It should not be construed as trading advice or a suggestion of any specific directional bias. Technical analysis is just one aspect of a comprehensive trading strategy. The technical setups discussed are intended to highlight potential areas of interest that other traders may be observing. Ultimately, all trading decisions, risk management strategies, and their resulting outcomes are the sole responsibility of each individual trader. Please trade responsibly.

