- The Australian Dollar holds losses as Trump’s tariff threats have created a headwind for the risk-sensitive currencies.
- The AUD struggles as Beijing begins retaliation against Trump trade sanctions, launching a probe into US-based Nvidia.
- The US Dollar gained ground following a hotter-than-expected US PPI report released on Thursday.
The Australian Dollar (AUD) continues to struggle against the US Dollar (USD) on Friday. The tariff threats from Trump’s administration have boosted the US Dollar (USD) across the board and created a headwind for the AUD/USD pair. Additionally, speculations about a potential 10% tariff on Chinese goods might drag the AUD lower as China has been the largest trading partner of Australia.
The AUD received support after the release of domestic mixed employment data on Thursday. The seasonally adjusted Employment Change rose by 35,600, bringing the total number of employed people to 14,535,500 in November. Meanwhile, the Unemployment Rate dropped to 3.9%, the lowest since March, lower than market estimates of 4.2%.
The US Dollar appreciated due to the hotter-than-expected US Producer Price Index (PPI) report released on Thursday. The US PPI jumped 0.4% MoM in November, the largest gain since June, after an upwardly revised 0.3% increase in October. This reading was better than the 0.2% expected.
The US Federal Reserve (Fed) interest rate decision will take center stage next week. Traders are now fully pricing in a 25 basis point rate cut on December 18, according to the CME FedWatch Tool.
Australian Dollar faces challenges due to tariff threats from Trump’s administration
- Beijing has already begun retaliation against Trump trade sanctions, launching a probe into Nvidia, threatening to blacklist a US apparel company, blocking the export of critical minerals to the United States, and tightening the supply chain for drones.
- US Consumer Price Index (CPI) rose to 2.7% year-over-year in November from 2.6% in October. The headline CPI reported a 0.3% reading MoM, in line with the market consensus. Meanwhile, the core CPI, excluding volatile food and energy prices, climbed 3.3% YoY, while the core CPI increased 0.3% MoM in November, as expected.
- The Australian Dollar received downward pressure on Wednesday as China, a key trading partner of Australia, saw its top leaders and policymakers consider letting the Chinese Yuan fall in response to an expected sharp hike in US tariffs, per Reuters.
- China President Xi Jinping stated on Tuesday, “China has full confidence in achieving this year’s economic target.” Xi emphasized that China will continue to serve as the largest engine of global economic growth and asserted that there would be no winners in tariff wars, trade wars, or tech wars.
- China’s Trade Balance (CNY) increased to CNY 692.8 billion in November, up from CNY 679.1 billion in the previous month. Exports grew by 1.5% year-over-year in November, compared to the 11.2% rise in October. Meanwhile, imports increased by 1.2% YoY, recovering from the 3.7% decline recorded earlier.
- The RBA kept the Official Cash Rate (OCR) unchanged at 4.35% in its final policy meeting in December. RBA Governor Michele Bullock highlighted that while upside inflation risks have eased, they persist and require ongoing vigilance. The RBA will closely monitor all economic data, including employment figures, to guide future policy decisions.
- Australia’s economy grew at its slowest annual pace since the pandemic in the third quarter. The OZ nation’s Gross Domestic Product (GDP) rose 0.3% in the September quarter, missing market forecasts of 0.4%. Weaker-than-expected GDP growth made markets almost fully price in a rate cut next April at 96% (from 73% before), according to Refinitive interest rate probabilities data.
Technical Analysis: Australian Dollar maintains its position above 0.6350, yearly lows
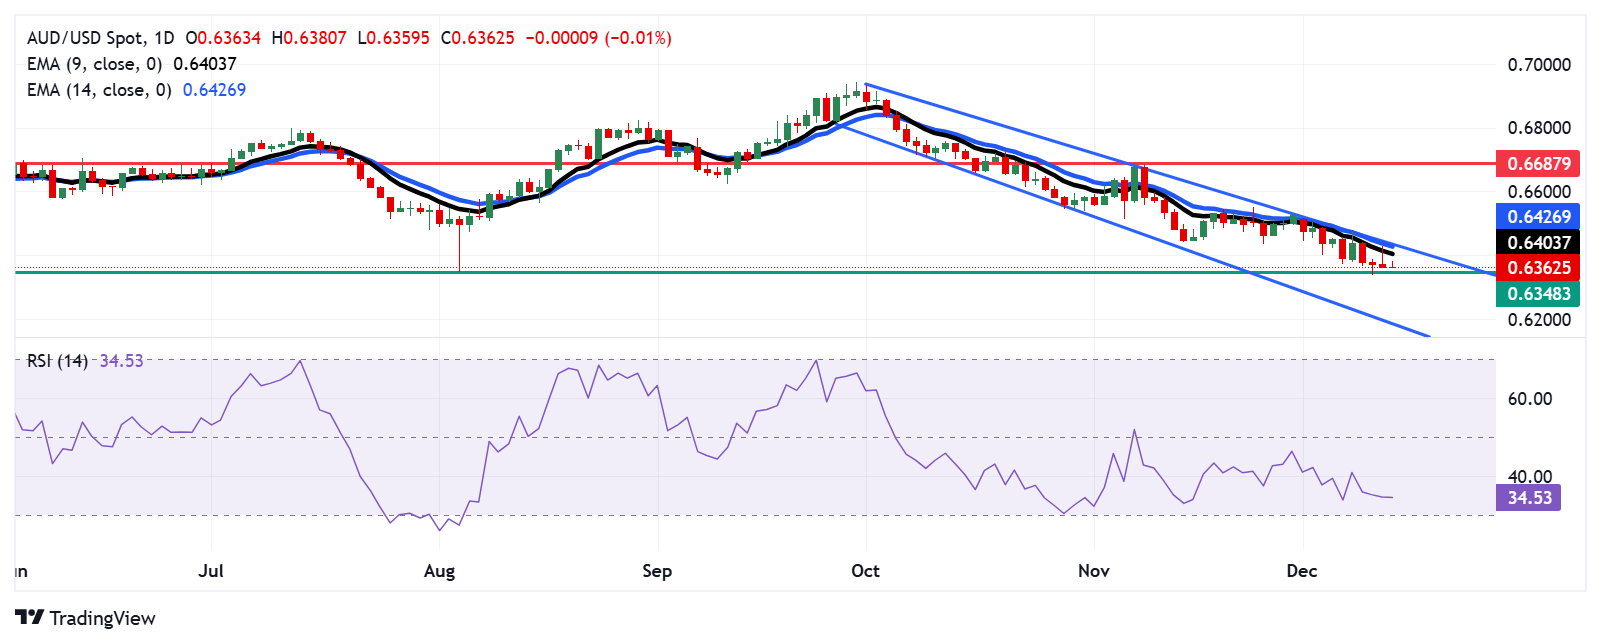
The AUD/USD pair hovers near 0.6360 on Friday. The daily chart analysis suggests a strengthening bearish bias as the pair moves downwards within a descending channel pattern. The 14-day Relative Strength Index (RSI) also remains slightly above the 30 level, indicating sustained bearish momentum.
The yearly low of 0.6348, last seen on August 5, serves as immediate support. A successful break below this level could strengthen the bearish bias and lead the AUD/USD pair toward the descending channel’s lower boundary around the 0.6190 level.
On the upside, the AUD/USD pair may find initial resistance around the nine-day Exponential Moving Average (EMA) at 0.6404. The next barrier appears at the 14-day EMA at 0.6427, which is aligned with the upper boundary of the descending channel. A decisive breakout above this channel could drive the pair toward the seven-week high of 0.6687.
AUD/USD: Daily Chart
Australian Dollar PRICE Today
The table below shows the percentage change of Australian Dollar (AUD) against listed major currencies today. Australian Dollar was the weakest against the US Dollar.
| USD | EUR | GBP | JPY | CAD | AUD | NZD | CHF | |
|---|---|---|---|---|---|---|---|---|
| USD | 0.06% | 0.06% | 0.21% | 0.09% | 0.05% | 0.04% | 0.06% | |
| EUR | -0.06% | 0.00% | 0.16% | 0.02% | -0.01% | -0.01% | 0.00% | |
| GBP | -0.06% | 0.00% | 0.17% | 0.01% | -0.01% | -0.01% | 0.00% | |
| JPY | -0.21% | -0.16% | -0.17% | -0.13% | -0.18% | -0.19% | -0.17% | |
| CAD | -0.09% | -0.02% | -0.01% | 0.13% | -0.05% | -0.04% | -0.03% | |
| AUD | -0.05% | 0.00% | 0.00% | 0.18% | 0.05% | -0.01% | 0.01% | |
| NZD | -0.04% | 0.01% | 0.01% | 0.19% | 0.04% | 0.00% | 0.02% | |
| CHF | -0.06% | -0.01% | -0.00% | 0.17% | 0.03% | -0.01% | -0.02% |
The heat map shows percentage changes of major currencies against each other. The base currency is picked from the left column, while the quote currency is picked from the top row. For example, if you pick the Australian Dollar from the left column and move along the horizontal line to the US Dollar, the percentage change displayed in the box will represent AUD (base)/USD (quote).


