The VanEck Semiconductor ETF (SMH) is an exchange-traded fund that tracks a market-cap weighted index composed of 25 of the largest U.S.-listed semiconductor companies. The top holdings of SMH include companies like NVIDIA, Taiwan Semiconductor Manufacturing, Broadcom Inc., Texas Instruments, QUALCOMM, ASML Holding N.V., Applied Materials, Inc., Lam Research Corporation, Micron Technology, Inc., and Advanced Micro Devices, Inc.
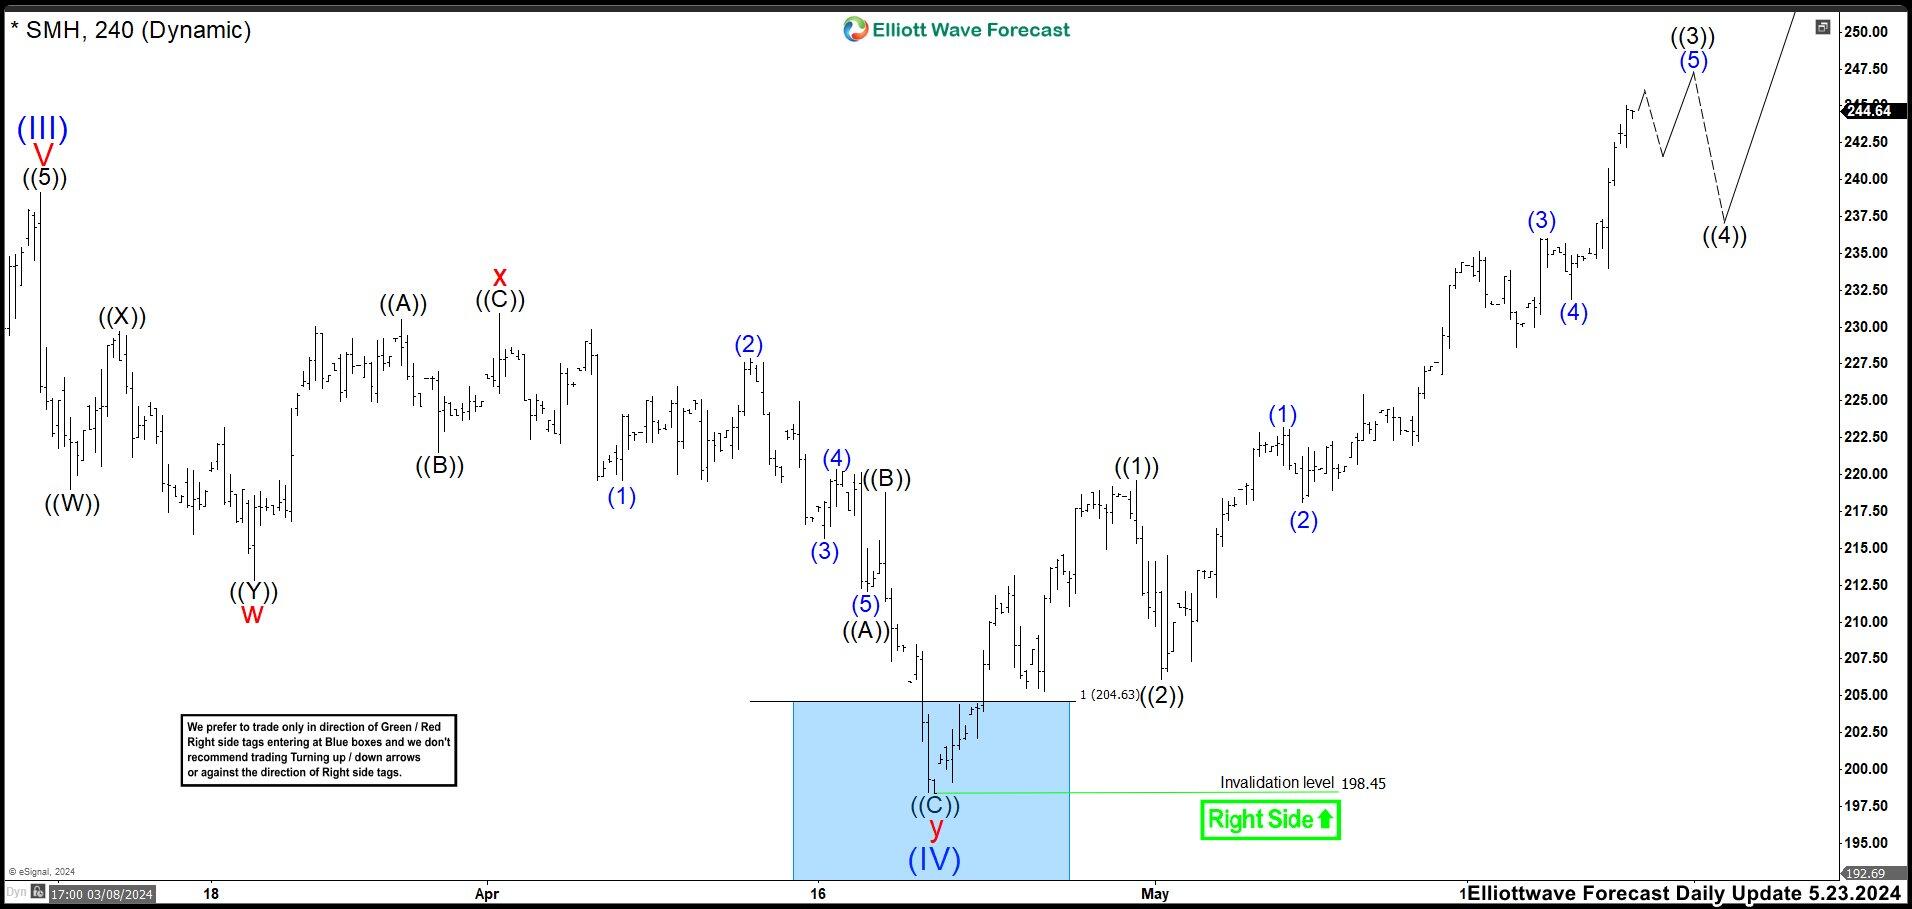
SMH four-hour chart May 23th
In May, we showed how SMH had reached the proposed blue box area. The idea was to look for buying opportunities in the zone to continue the upward movement. This correction ended a wave (IV) at 198.45 low and it had to continue with wave (V) that broke the peak of wave (III). In the chart, it can be seen that the market broke wave (III) high as we expected.
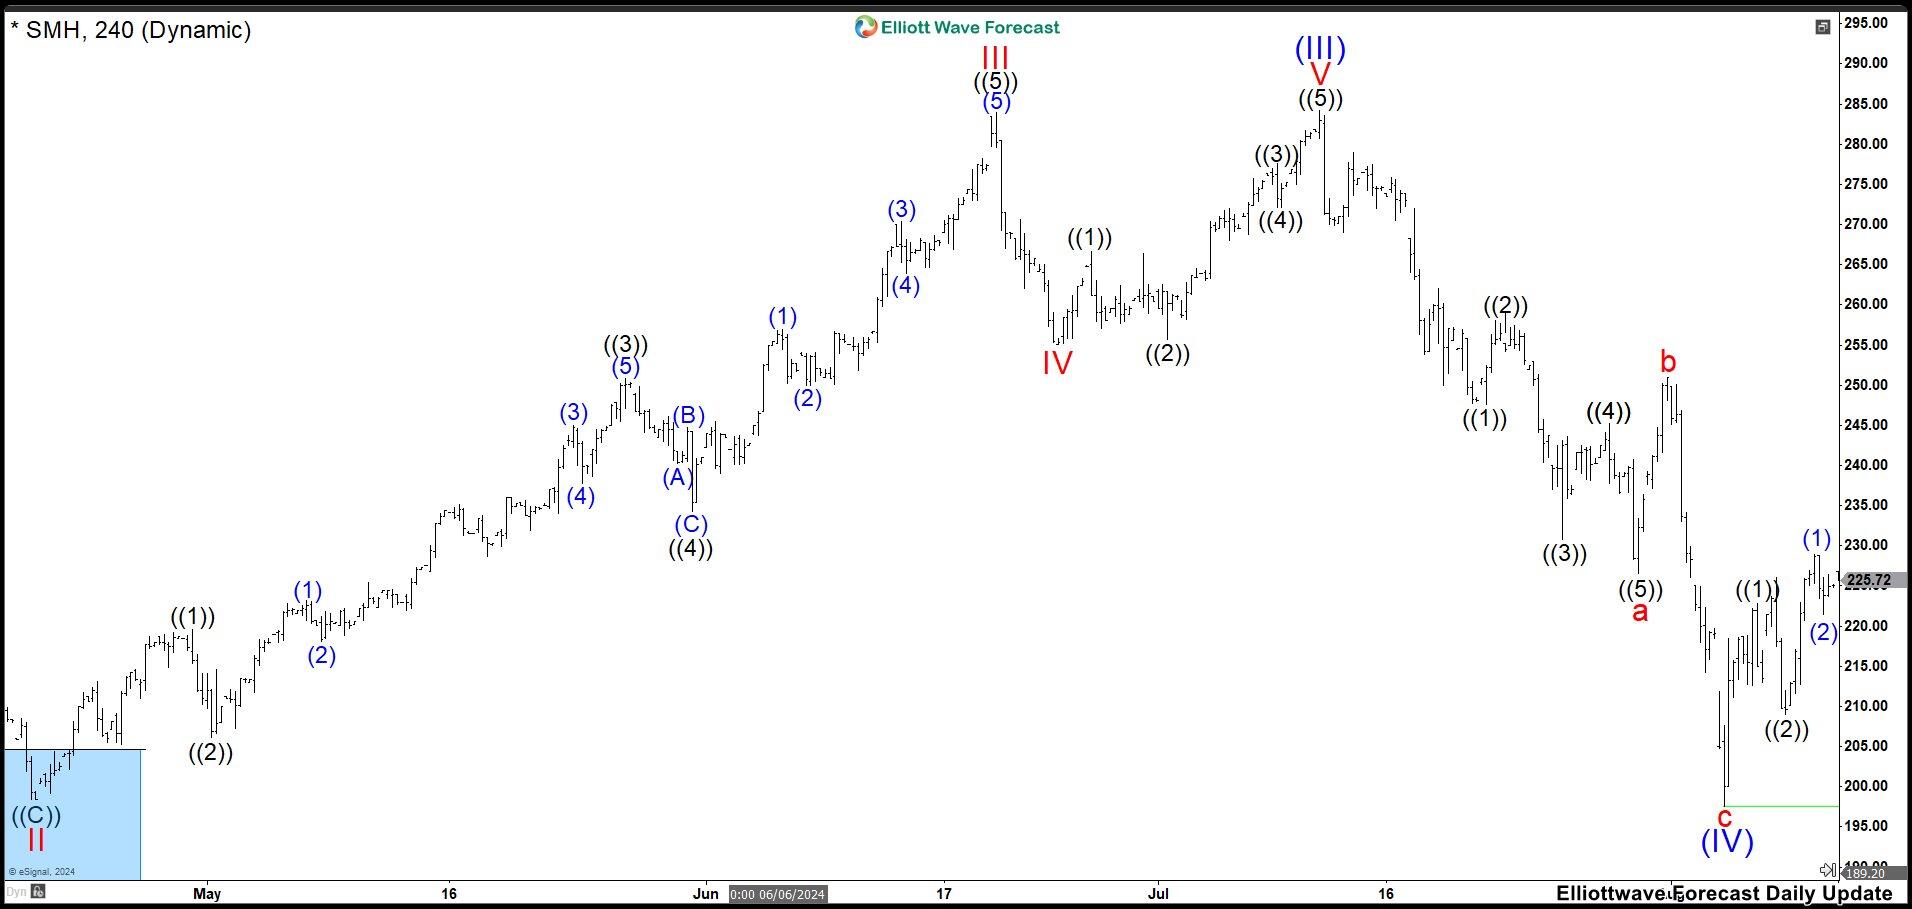
SMH four-hour chart blue box reaction
In the chart above, we can clearly see the market reaction from the blue box. We expected to reach as target the price of 265, giving us a profit of more than 29%; however, it reached as high as 284.26. This unexpected extension made us to adjust the count. Suggesting that SMH was still trading in wave (III). Therefore, what was wave (IV) became wave II and thus a wave (III) was formed ending at 284.26 high.
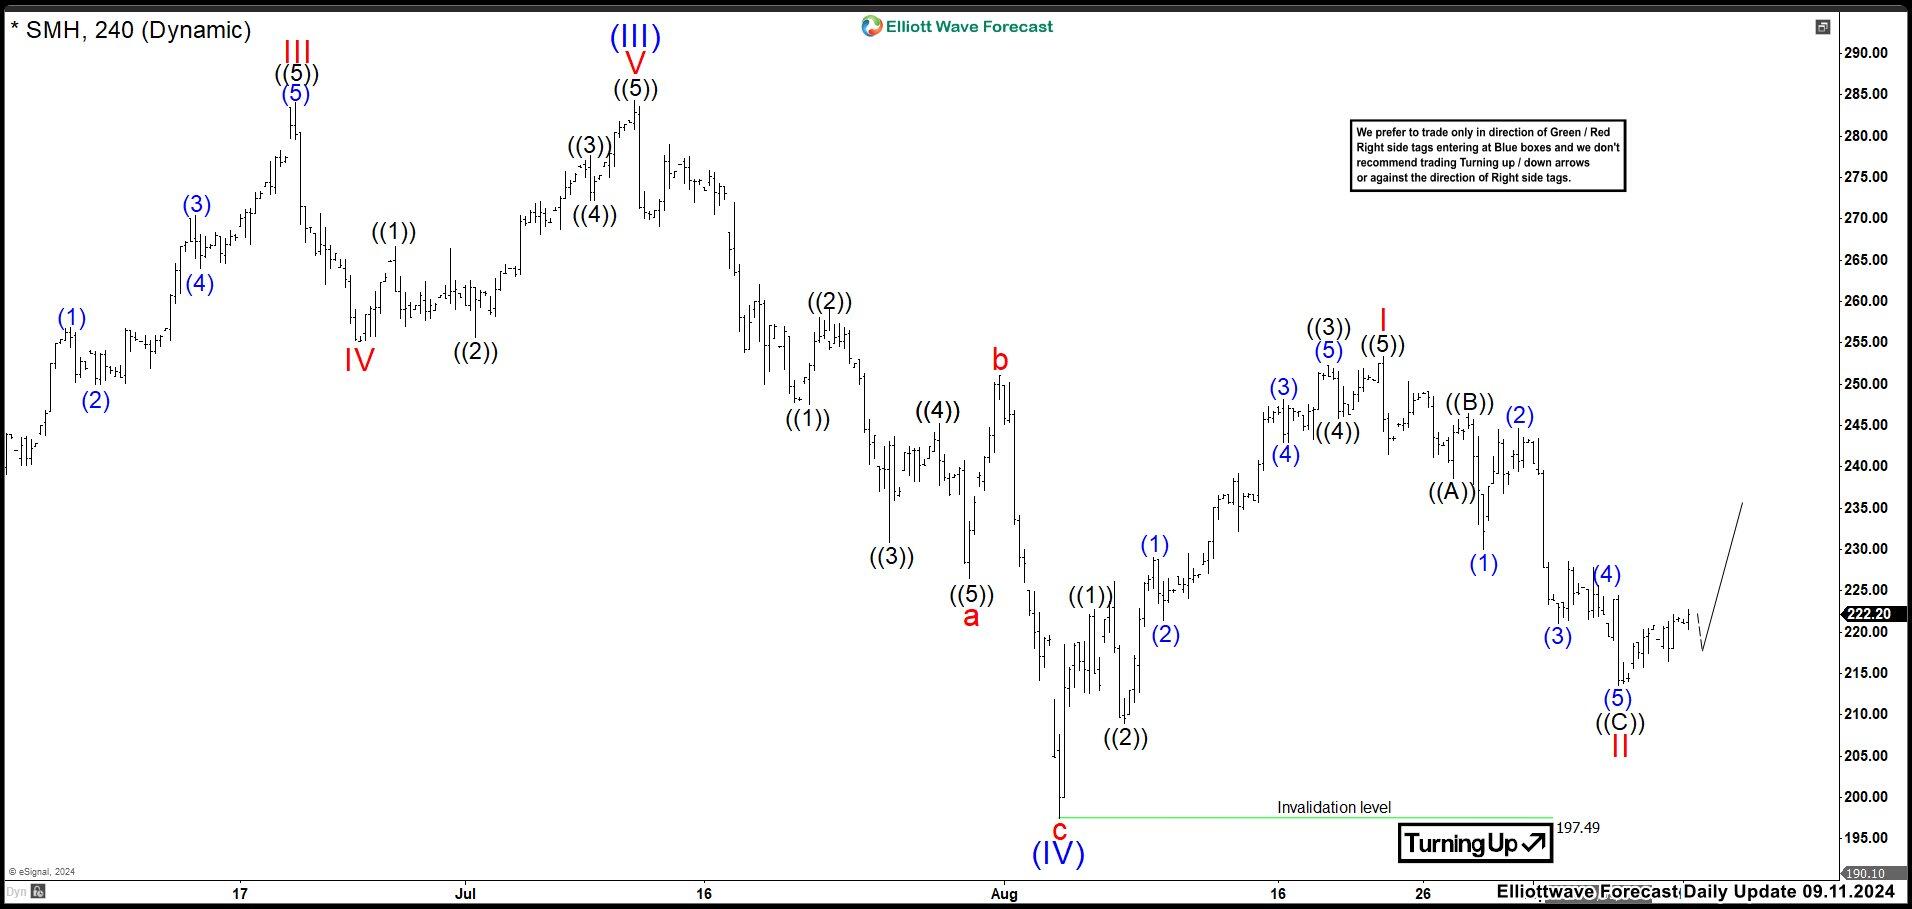
SMH four-hour chart September 11th
After completing wave (III), we had a deep pullback as a zig zag correction. Down from wave (III), wave “a”ended at 226.50 low and bounce as wave “b” ended at 251.00 high. Last push lower completed wave “c” and a wave (IV) at 197.50 low. Then, SMH started the uptrend again and wave (V). It built an impulse structure ending at 253.32 high as wave I. Pullback as wave II ended at 213.57 low. From here, we were expecting to continue the rally in wave III of (V). Ideally, the market should break 284.26 high as target to end wave (V). In case, if this rally does not break above wave (III), the next target to keep an eye comes around 269.50 level.


