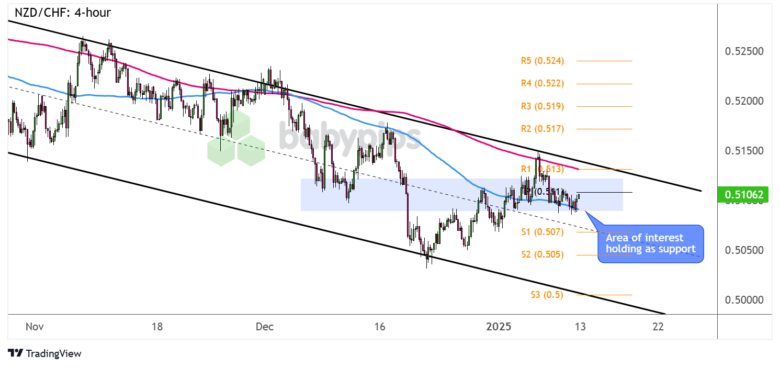
This Kiwi pair has formed lower highs and lower lows inside a falling channel on its 4-hour time frame.
Is the trend still our friend or can we see a breakout and reversal soon?
Take a look at these inflection points!

NZD/CHF 4-hour Forex Chart by TradingView
NZD/CHF has been cruising steadily south in its falling channel since November last year, and it looks like price bounced off the resistance yet again.
However, buyers appear to be defending the near-term area of interest around the .5100 major psychological mark, possibly leading to another test of the channel top.
Or are Kiwi bulls gearing up for a break higher soon?
Remember that directional biases and volatility conditions in market price are typically driven by fundamentals. If you haven’t yet done your homework on the New Zealand dollar and the Swiss franc, then it’s time to check out the economic calendar and stay updated on daily fundamental news!
The 100 SMA is still below the 200 SMA on this time frame, suggesting that the downtrend is more likely to resume than to reverse. Look out for a move back below the resistance-turned-support zone to suggest that a continuation of the slide to S1 (.5070) then S2 (.5050) or all the way down to the channel bottom could follow.
Then again, a move past the channel top and R1 (.5130) near the 200 SMA dynamic inflection point could bring reversal vibes in the mix, potentially lifting NZD/CHF up to the next upside targets at R2 (.5170) then R3 (.5190).
Whichever bias you end up trading, don’t forget to practice proper risk management and stay aware of top-tier catalysts that could influence overall market sentiment!

