- Gold price pops to 2,685 on the back of a strong US Jobs report.
- The Fed remains data dependent despite market conviction inflation will surge in 2025.
- Gold attempts to breakout towards $2,700, with help of the upbeat US employment report.
Gold’s price (XAU/USD) is set to close off this week on a high note while trading in its fourth straight day of gains. The upbeat Nonfarm payrolls number came in at 256,000 works, which was very close to the maximum upside call of 260,000. The number is enough to fuel inflation concerns further, with markets pricing in a Federal Reserve (Fed) rate cut by October 2025 at earliest, against July earlier this week.
Going forward now, risk will be that the Fed will remain data dependent and leave markets to its own devices. With only ten days to go before President-elect Donald Trump’s inauguration, risk could be that once Trump takes office, economic numbers will start to drive concers further up. That could make $3,000 for gold by the summer a not-so crazy assumption.
Daily digest market movers: Quite good numbers
- India’s government acknowledged it miscalculated import figures for precious metals for months. Preliminary estimates released earlier this week suggested gold imports for November stood at $9.84 billion — about $5 billion, or a third, lower than what was previously reported for the month. The ministry said Thursday it’s still in the process of the data, Bloomberg reports.
- Fed officials until now have signaled they’ll likely hold interest rates at current levels for an extended period, only cutting again when inflation meaningfully cools, Bloomberg reports.
- The US employment report for December has been released:
- Nonfarm Payrolls headline datashowed 256,000 new workers against the previous 227,000 in November.
- The Unemployment Rate fell to 4.1%, from 4.2%.
- The monthly Average Hourly Earnings came in at 0.3% in December from the previous 0.4%.
- Near 20:30, Gold NC Net Positions will be released by the Commodity Futures Trading Commission (CFTC). Forecast for this time is not available but previous positioning was at $247,300 The report provides information on the size and the direction of the positions taken, across all maturities, participants primarily based in Chicago and New York futures markets. Forex traders focus on “non-commercial” or speculative positions, to determine whether a trend remains healthy or not and also market sentiment towards a certain asset.
Technical Analysis: Break out, consolidation and rally
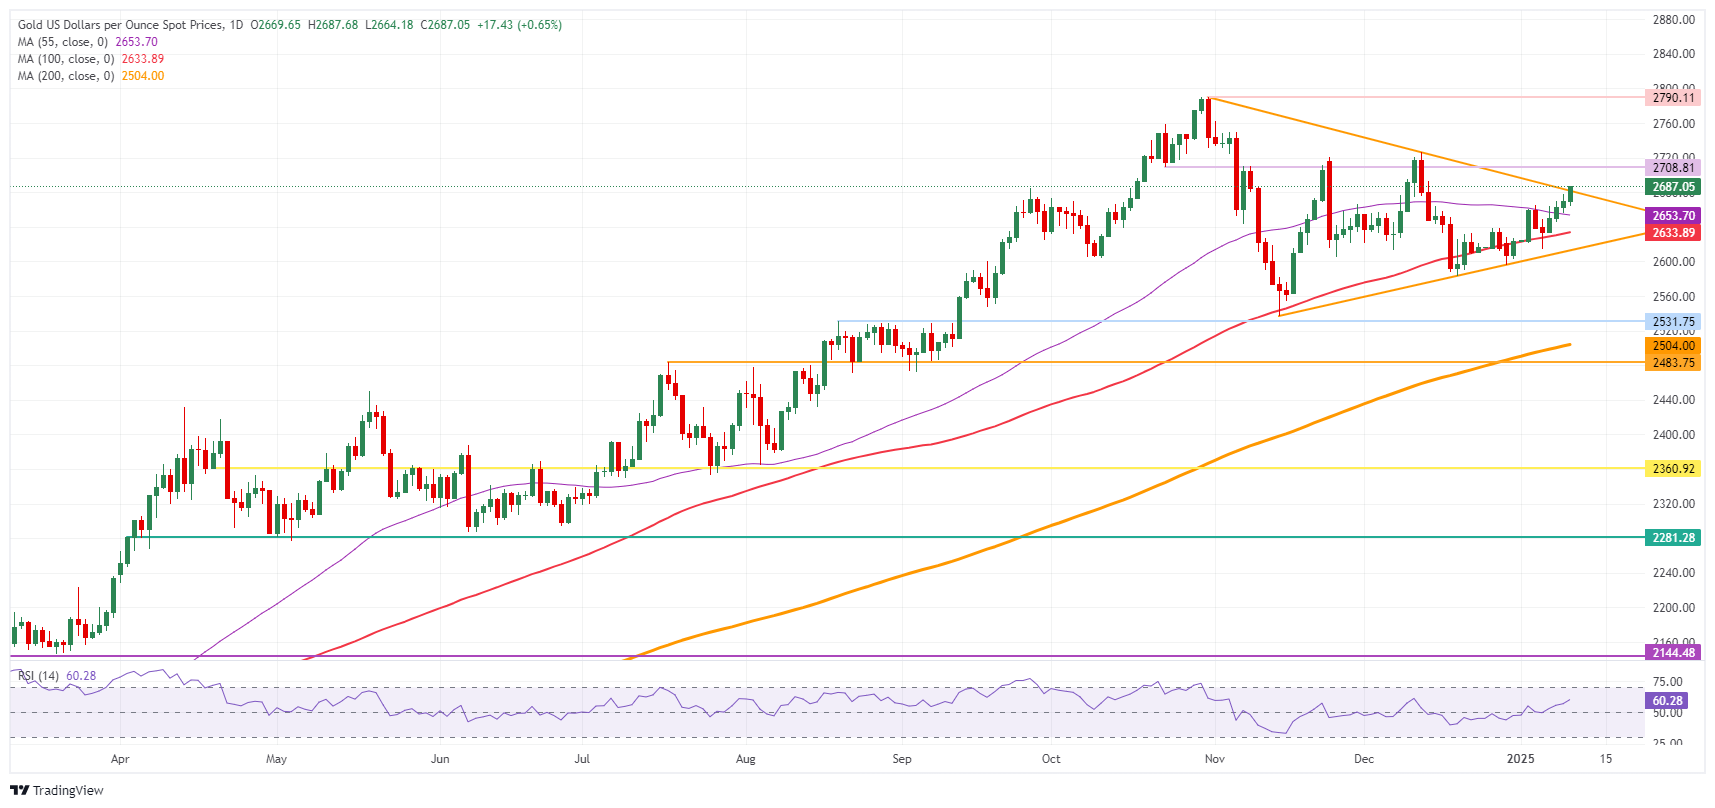
It’s money time for Bullion as the price action knocks on the door of the upper band of the pennant chart formation on Friday. This afternoon’s US employment report will act as a catalyst and could push price action above the resistance zone, with prospects of a rise to $2,700 in the cards. A rejection would mean a move lower, with $2,614 possibly coming back into play.
On the downside, the 55-day SMA at $2,653 acts as the first support after it saw a daily close above it on Wednesday. The 100-day Simple Moving Average (SMA) at $2,633 is the next in line. Further down, the ascending trend line of the pennant pattern should provide support at around $2,614, as it did in the past three occasions. In case that support line snaps, a quick decline to $2,531 (August 20, 2024, high) could come back into play as support level.
On the upside, the descending trendline in the pennant chart formation at $2,682 is the first big upside level to watch. Once through there, $2,708 is the next pivotal level to look out for.
XAU/USD: Daily Chart
Gold FAQs
Gold has played a key role in human’s history as it has been widely used as a store of value and medium of exchange. Currently, apart from its shine and usage for jewelry, the precious metal is widely seen as a safe-haven asset, meaning that it is considered a good investment during turbulent times. Gold is also widely seen as a hedge against inflation and against depreciating currencies as it doesn’t rely on any specific issuer or government.
Central banks are the biggest Gold holders. In their aim to support their currencies in turbulent times, central banks tend to diversify their reserves and buy Gold to improve the perceived strength of the economy and the currency. High Gold reserves can be a source of trust for a country’s solvency. Central banks added 1,136 tonnes of Gold worth around $70 billion to their reserves in 2022, according to data from the World Gold Council. This is the highest yearly purchase since records began. Central banks from emerging economies such as China, India and Turkey are quickly increasing their Gold reserves.
Gold has an inverse correlation with the US Dollar and US Treasuries, which are both major reserve and safe-haven assets. When the Dollar depreciates, Gold tends to rise, enabling investors and central banks to diversify their assets in turbulent times. Gold is also inversely correlated with risk assets. A rally in the stock market tends to weaken Gold price, while sell-offs in riskier markets tend to favor the precious metal.
The price can move due to a wide range of factors. Geopolitical instability or fears of a deep recession can quickly make Gold price escalate due to its safe-haven status. As a yield-less asset, Gold tends to rise with lower interest rates, while higher cost of money usually weighs down on the yellow metal. Still, most moves depend on how the US Dollar (USD) behaves as the asset is priced in dollars (XAU/USD). A strong Dollar tends to keep the price of Gold controlled, whereas a weaker Dollar is likely to push Gold prices up.


