- The Australian Dollar appreciates as softer US PCE data revive hopes of the Fed’s further policy easing in 2025.
- The AUD receives downward pressure as the RBA may begin rate cuts in February.
- CME FedWatch tool suggests a more than 90% probability of the Fed keeping rates unchanged in January.
The Australian Dollar (AUD) steadies following two days of gains on Monday as the US Dollar (USD) remains subdued following the Personal Consumption Expenditures Price Index (PCE) data from the United States (US) released on Friday.
Softer US inflation data for November has strengthened market expectations that the Federal Reserve (Fed) will continue its policy easing in 2025. However, according to the CME FedWatch tool, markets now anticipate a more than 90% probability that the Federal Reserve (Fed) will keep interest rates unchanged in January, maintaining the current range of 4.25%–4.50%.
The Reserve Bank of Australia (RBA) is expected to begin cutting its cash rate as early as February, amid mounting signs of an economic slowdown. Traders are preparing for the upcoming release of the Reserve Bank of Australia’s (RBA) meeting minutes due on Tuesday, following its decision to hold interest rates steady at 4.35% for the ninth consecutive meeting.
Australian Dollar advances as traders expect Fed to continue rate cuts in 2025
- US core PCE inflation year-over-year, the Fed’s preferred inflation measure, rose steadily by 2.8%, slower than estimates of 2.9%. The monthly core inflation grew moderately by 0.1%, against estimates of 0.2% and the prior release of 0.3%.
- Australia’s Private Sector Credit grew by 0.5% month-over-month in November, aligning with expectations. This followed a 0.6% increase in October, which marked the fastest monthly growth in four months. On an annual basis, Private Sector Credit rose by 6.2% in November, the highest growth rate since May 2023, up slightly from 6.1% in October.
- On Friday, the People’s Bank of China (PBoC) decided to keep its one- and five-year Loan Prime Rates (LPRs) unchanged at 3.10% and 3.60%, respectively, in the fourth quarterly meeting.
- US Gross Domestic Product (GDP) Annualized reported a 3.1% growth rate in the third quarter, surpassing both market expectations and the previous reading of 2.8%. Additionally, Initial Jobless Claims dropped to 220,000 for the week ending December 13, down from 242,000 in the prior week and below the market forecast of 230,000.
- National Australia Bank (NAB) maintained its forecast for the first Reserve Bank of Australia rate cut at the May 2025 meeting, though they acknowledged February as a possibility. NAB’s report indicates that the Unemployment Rate is expected to peak at 4.3% before easing to 4.2% by 2026 as the economy stabilizes. The Q4 trimmed mean inflation is projected at 0.6% quarter-on-quarter, with a gradual easing expected, reaching 2.7% by late 2025.
- Reserve Bank of Australia Governor Michele Bullock highlighted the continued strength of the labor market as a key reason the RBA has been slower than other nations to commence its monetary easing cycle.
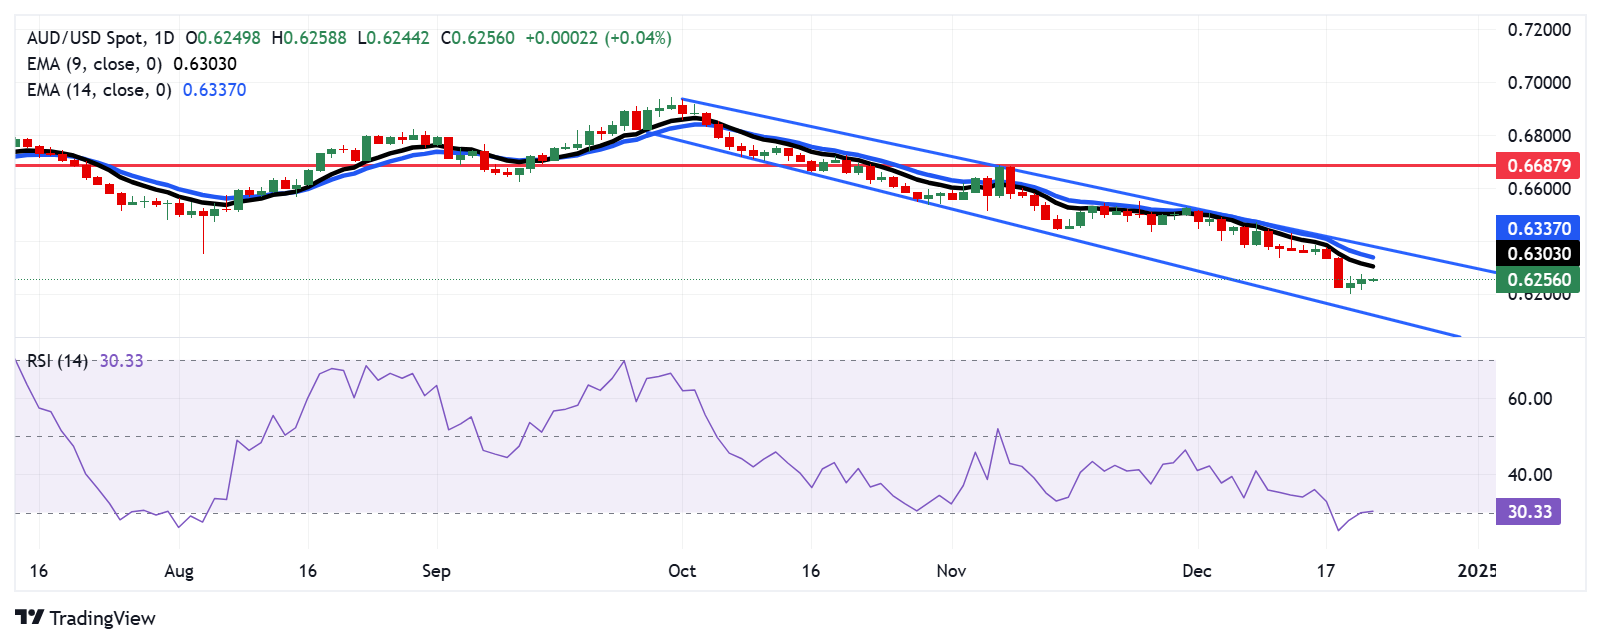
Australian Dollar hovers near 0.6250, bullish RSI backs a bounce
The AUD/USD pair trades near 0.6250 on Monday, with daily chart analysis indicating a persistent bearish bias as the pair remains within a descending channel pattern. However, the 14-day Relative Strength Index (RSI) hovers above the 30 level, hinting at a potential near-term upward correction.
On the downside, the AUD/USD pair may test the lower boundary of the descending channel, located near the 0.6120 support level.
The AUD/USD pair will likely encounter primary resistance near the nine-day Exponential Moving Average (EMA) at 0.6303, followed by the 14-day EMA at 0.6337. A further hurdle lies at the descending channel’s upper boundary around 0.6380. A decisive breakout above this channel could propel the pair toward the nine-week high of 0.6687.
AUD/USD: Daily Chart
Australian Dollar PRICE Today
The table below shows the percentage change of Australian Dollar (AUD) against listed major currencies today. Australian Dollar was the strongest against the Japanese Yen.
| USD | EUR | GBP | JPY | CAD | AUD | NZD | CHF | |
|---|---|---|---|---|---|---|---|---|
| USD | -0.07% | -0.09% | 0.08% | -0.08% | -0.04% | -0.01% | 0.05% | |
| EUR | 0.07% | -0.06% | 0.08% | -0.03% | 0.09% | 0.04% | 0.10% | |
| GBP | 0.09% | 0.06% | 0.10% | 0.03% | 0.15% | 0.10% | 0.17% | |
| JPY | -0.08% | -0.08% | -0.10% | -0.11% | -0.04% | -0.05% | -0.04% | |
| CAD | 0.08% | 0.03% | -0.03% | 0.11% | 0.09% | 0.09% | 0.13% | |
| AUD | 0.04% | -0.09% | -0.15% | 0.04% | -0.09% | -0.05% | 0.01% | |
| NZD | 0.00% | -0.04% | -0.10% | 0.05% | -0.09% | 0.05% | 0.03% | |
| CHF | -0.05% | -0.10% | -0.17% | 0.04% | -0.13% | -0.01% | -0.03% |
The heat map shows percentage changes of major currencies against each other. The base currency is picked from the left column, while the quote currency is picked from the top row. For example, if you pick the Australian Dollar from the left column and move along the horizontal line to the US Dollar, the percentage change displayed in the box will represent AUD (base)/USD (quote).

