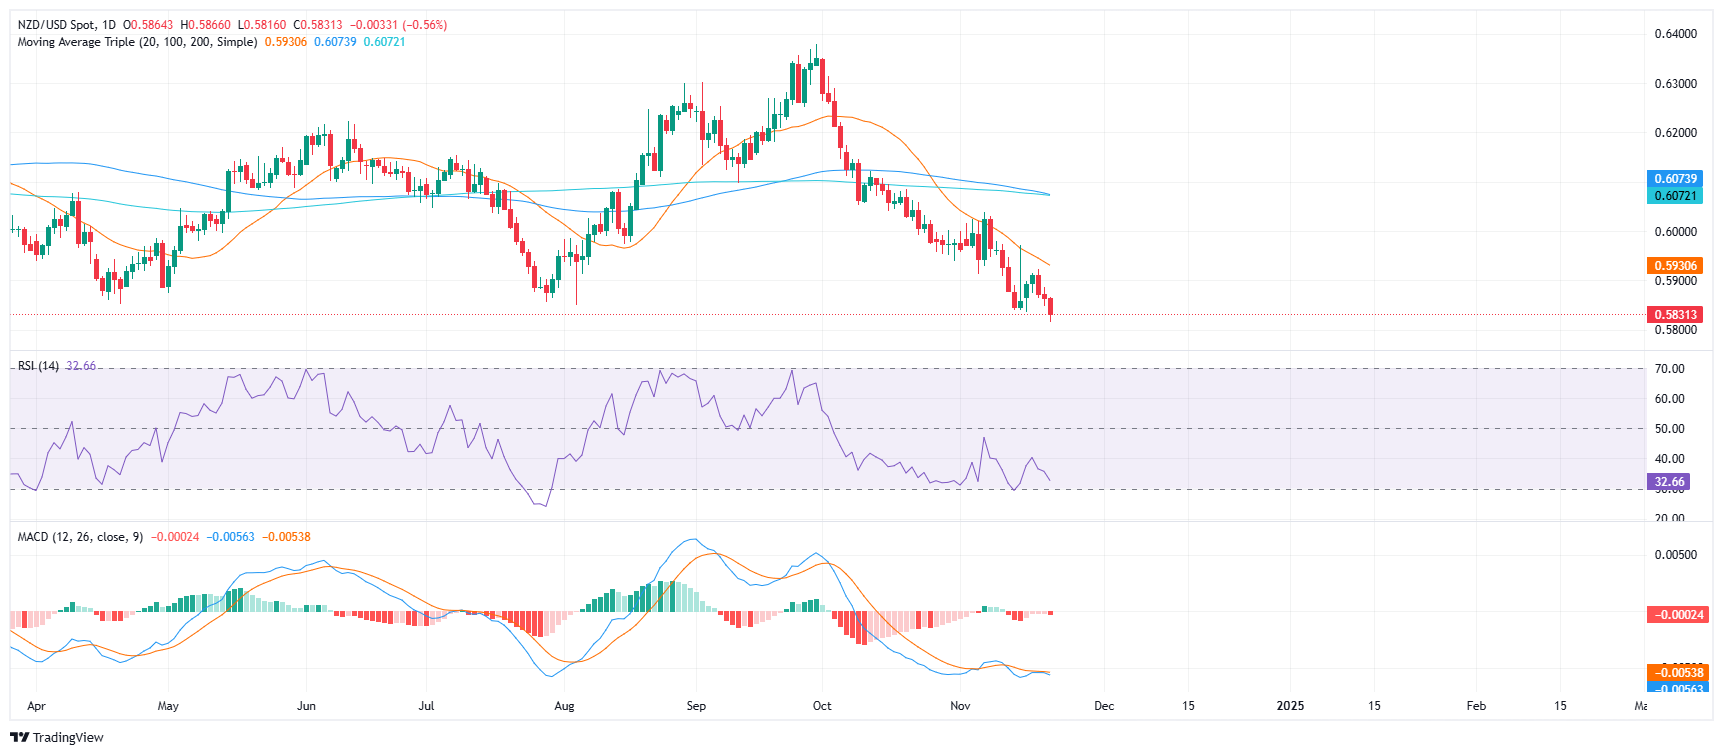
- NZD/USD dipped by 0.54% on Friday, plunging to 0.5830.
- NZD/USD fell to the lowest level since early November as bears maintained control.
- While oversold conditions, as per indicators, could hint at a correction, the NZD/USD outlook remains negative towards the 0.5800-0.5900 range.
The NZD/USD pair extended its losses on Friday, declining by 0.54% to 0.5830, its lowest level since early November.
The technical indicators align with the bearish outlook, as the Relative Strength Index (RSI) has fallen sharply into the near oversold area at 33, indicating rising selling pressure. The RSI’s decline is supported by the Moving Average Convergence Divergence (MACD), which is red and rising, and its histogram is negative, suggesting a bearish overall outlook. This bearish outlook is further supported by the pair’s three-day losing streak and its trade below the 20-day Simple Moving Average (SMA) which is located at 0.5930.
While oversold conditions may lead to a correction, trades should eye the 0.5800-0.5900 range for sideways movements.
NZD/USD daily chart


