Fundamental
Overview
The US Dollar has been
gaining ground across the board this week despite the lack of economic data and
lower Treasury yields, essentially moving forward by inertia.
Stanley Druckenmiller said
in an interview yesterday that the market is already positioning for a Trump
victory given the moves in some stocks like DJT for example.
That could explain the
recent USD strength as it should appreciate on higher growth and less rate cuts
expectations. Nevertheless, not all markets have been in sync with this view,
so it could be just noise.
For now, we can only work
with data and today we get the US retail sales and jobless claims figures which
will likely be market moving. The key events though will be in November when we
get the October data and the US election.
On the AUD side, the Australian
labour market report today beat expectations across the board by a big
margin. Although it didn’t change much in terms of interest rate expectations,
it reinforces the RBA’s hawkish stance.
AUDUSD
Technical Analysis – Daily Timeframe
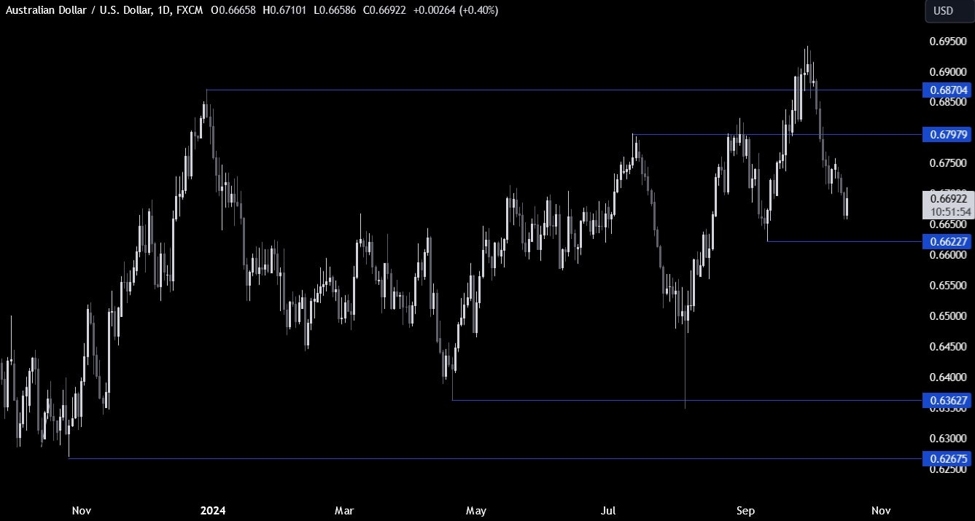
AUDUSD Daily
On the daily chart, we can
see that AUDUSD is getting closer to the 0.6622 level. If the price gets there,
we can expect the buyers to step in with a defined risk below the level to
position for a rally back into the 0.68 handle. The sellers, on the other hand,
will want to see the price breaking lower to increase the bearish bets into the
0.64 handle next.
AUDUSD Technical
Analysis – 4 hour Timeframe
AUDUSD 4 hour
On the 4 hour chart, we can
see that the price is tentatively breaking above the downward trendline. The sellers will likely keep on defending
the 0.67 handle but if the buyers manage to break higher, we might see a rally into
the 0.6750 level next.
AUDUSD Technical
Analysis – 1 hour Timeframe
AUDUSD 1 hour
On the 1 hour chart, we can
see more clearly the recent price action with the spike higher on the strong Australian
jobs report. There’s not much else we can add here as the buyers will look for
a break above the 0.67 handle, while the sellers will likely lean on it to
position for new lows. The red lines define the average daily range for today.
Upcoming
Catalysts
Today we have the US Retail Sales and US Jobless Claims data.


